


The trends in air quality data across the year are analysed using a breakdown of daily concentration percentiles for the year for each parameter and station. This approach assesses how pollutant concentrations are distributed across the year. The use of percentiles is similar to expressing the data as the Nth highest value. For example, the 95th percentile of daily peak concentrations corresponds to the 18th highest daily peak concentration if there is 100% data availability. For pollutants and stations where exceedances have been recorded, calendar plots (Figures 3-7) have been included to show the temporal distribution for when the exceedances occurred.
3.1 Particles (PM2.5)
In 2020 the peak 24-hour PM2.5 measurement at a NEPM station was 204.5 µg/m3 at Footscray on 14 January 2020. A peak reading of 214 µg/m3 was also measured at Alphington on the same day, however due to an issue with the flow controller, this measurement was invalid.
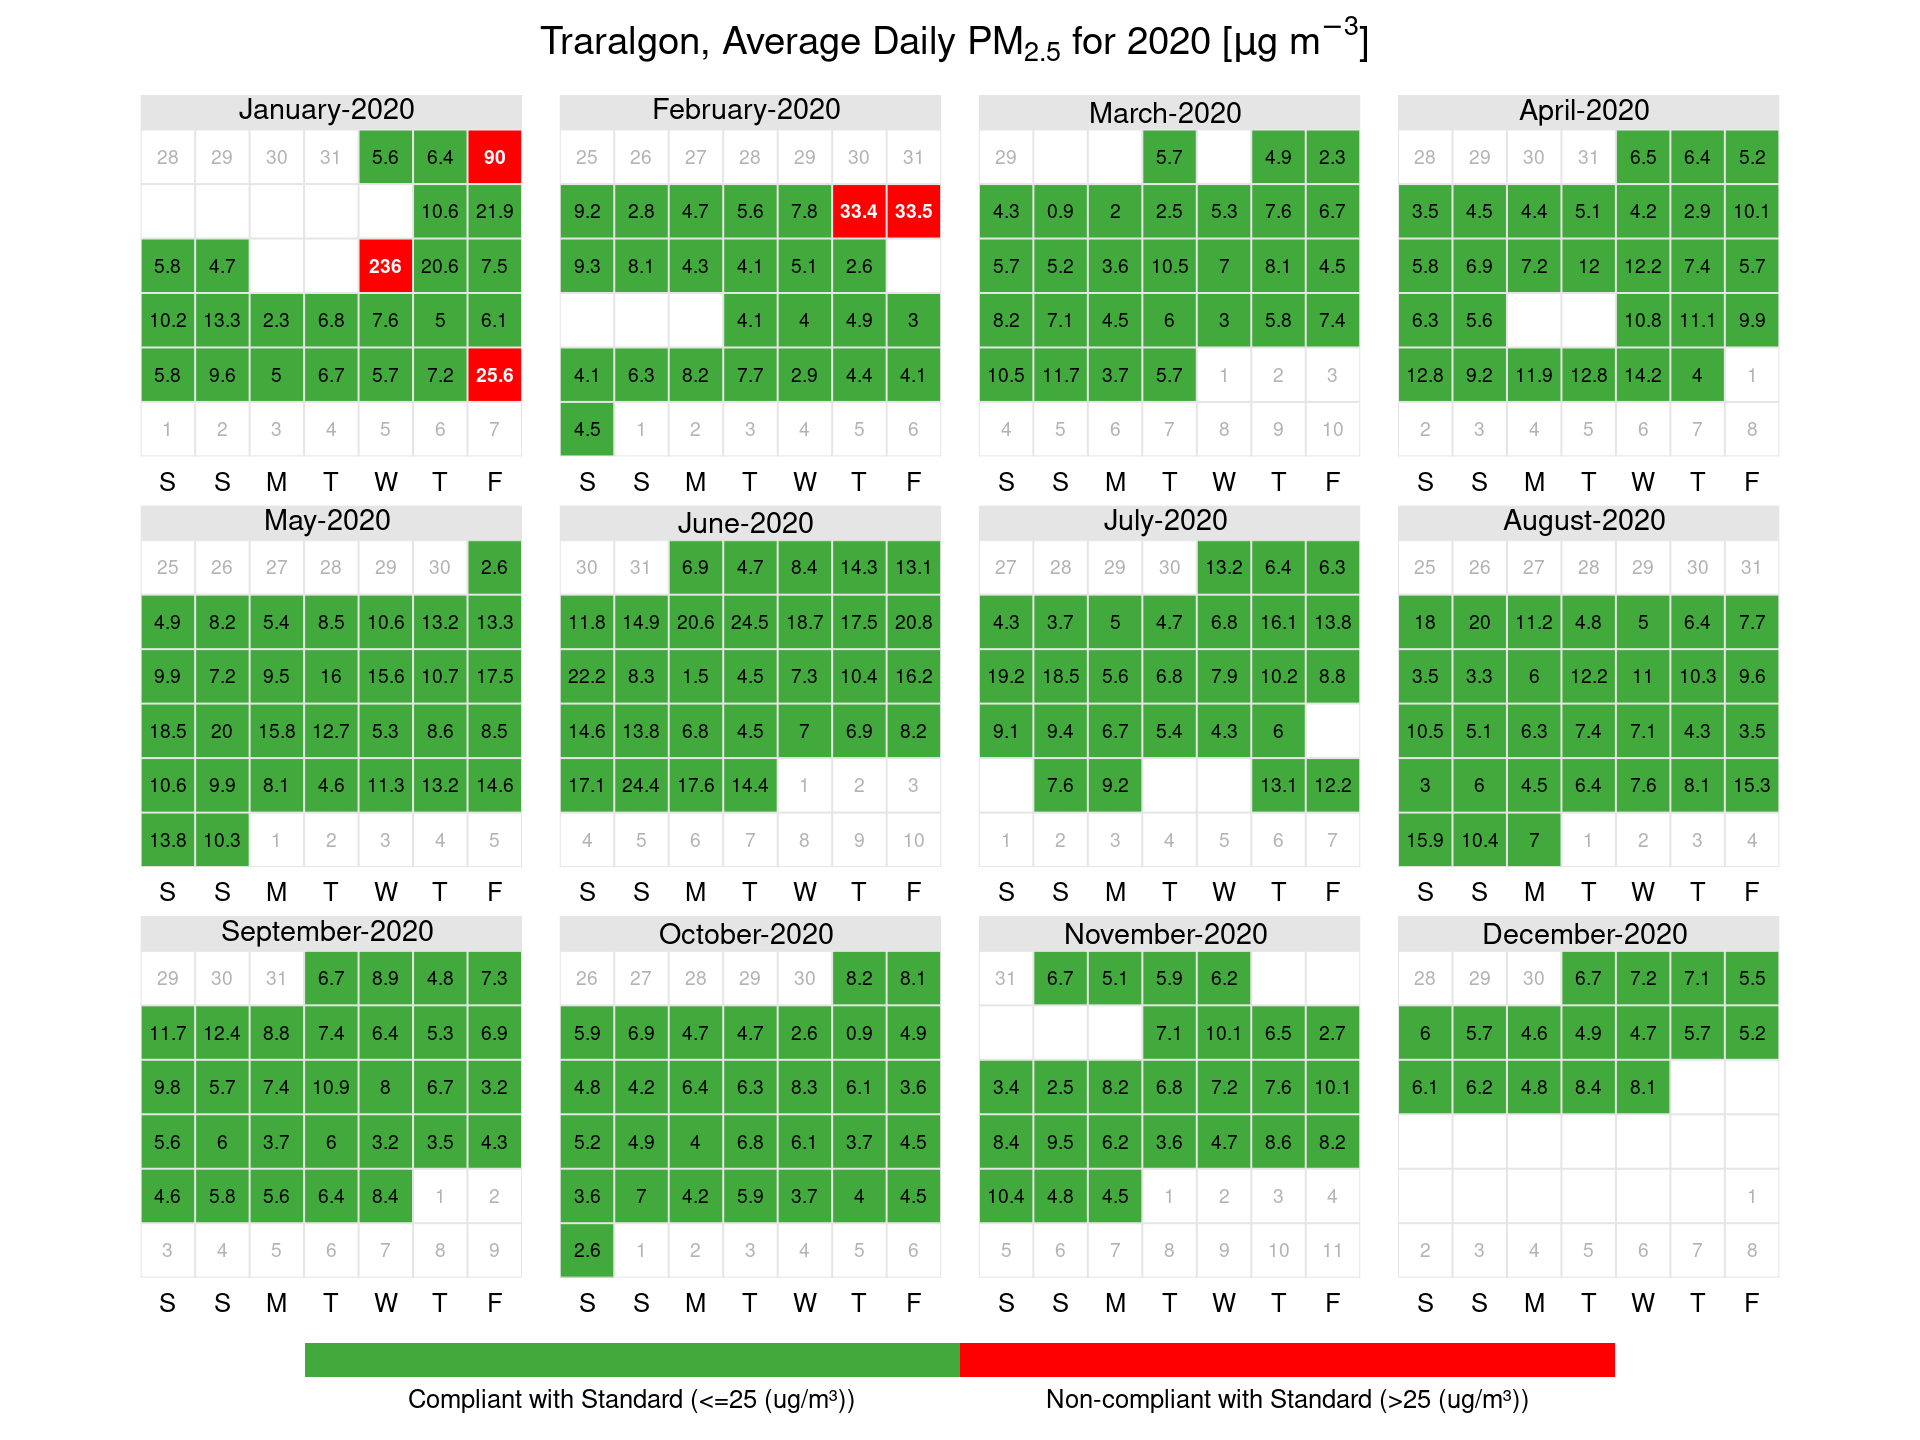
As shown in Figures 3 to 7, there were exceedances of the 24-hour standard recorded during the year, most of these occurred during Quarter 1 and were associated with major bushfires which were impacting the south east coast of Australia. Seven exceedances were recorded during May, June and July at Alphington and on two days during June and July at Melbourne CBD which were attributed to local wood heater impacts.
Table 19: 24-hour PM2.5 percentiles for 2020
| (% days) | Max | 99th | 98th | 95th | 90th | 75th | 50th | |
|---|---|---|---|---|---|---|---|---|
| Alphington | 76.5 | 35.66 | 27.89 | 25.94 | 19.05 | 13.52 | 9.01 | 6.37 |
| Footscray | 95.9 | 204.5 | 63.05 | 29.86 | 17.59 | 12.92 | 8.34 | 5.79 |
| Geelong South | 86.07 | 155.05 | 66.48 | 23.39 | 15.01 | 11.71 | 7.78 | 5.5 |
| Melbourne CBD | 96.99 | 196.31 | 69.19 | 26.92 | 18.54 | 12.81 | 7.67 | 5.28 |
| Traralgon | 89.07 | 236 | 31.42 | 23.29 | 18.49 | 14.49 | 9.94 | 6.74 |
Figure 3: Alphington PM2.5 calendar plots showing days where exceedances of the average daily PM2.5 standard occurred in µg/m3
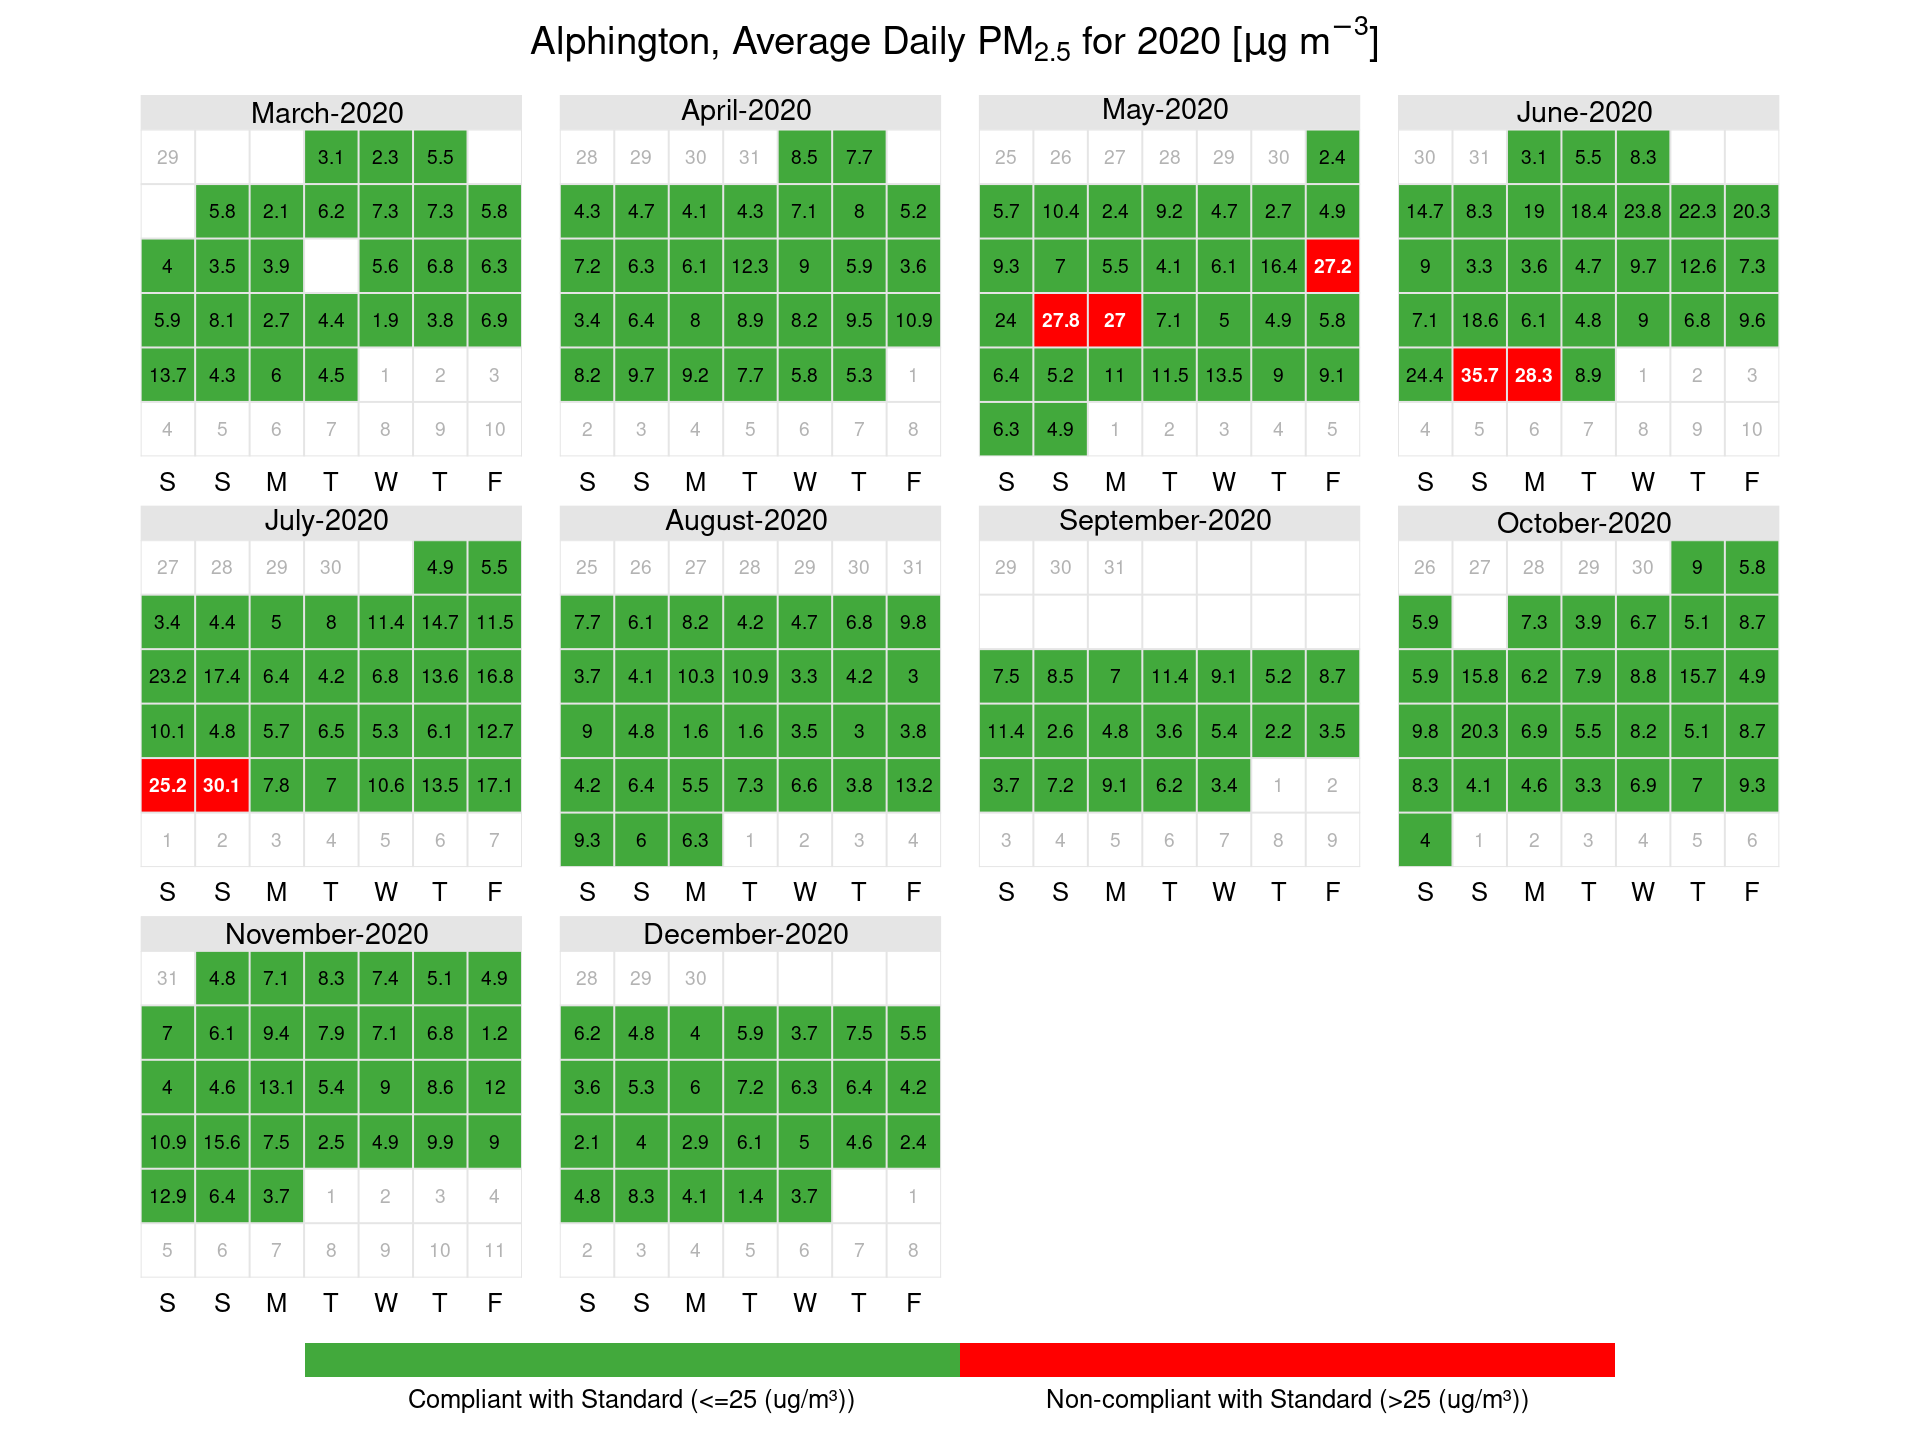
Figure 4: Footscray PM2.5 calendar plots showing days where exceedances of the average daily PM2.5 standard occurred in µg/m3
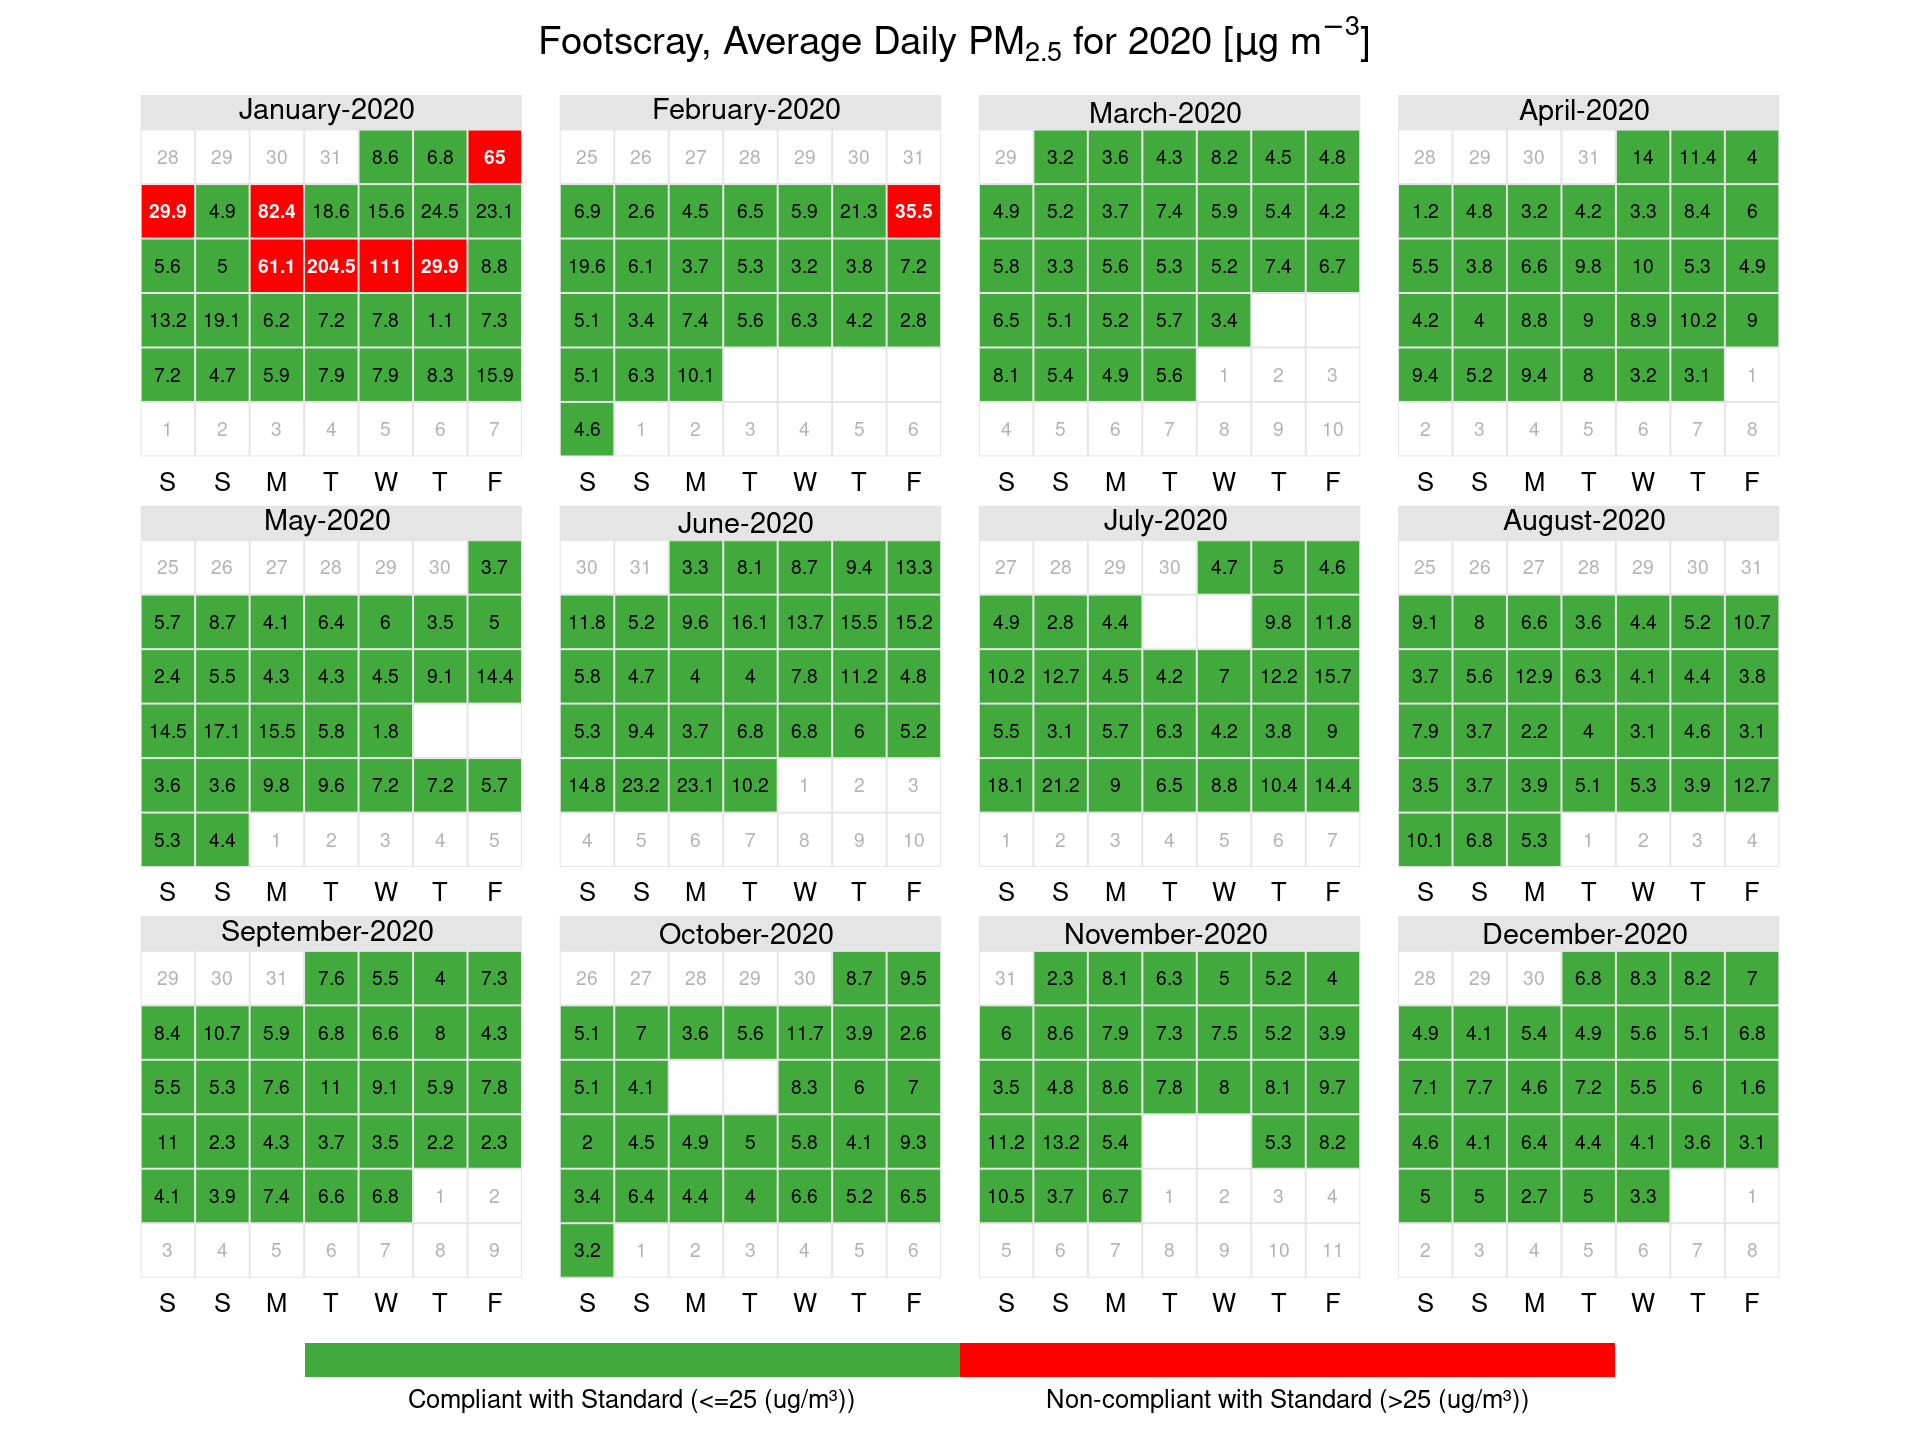
Figure 5: Geelong South PM2.5 calendar plots showing days where exceedances of the average daily PM2.5 standard occurred in µg/m3
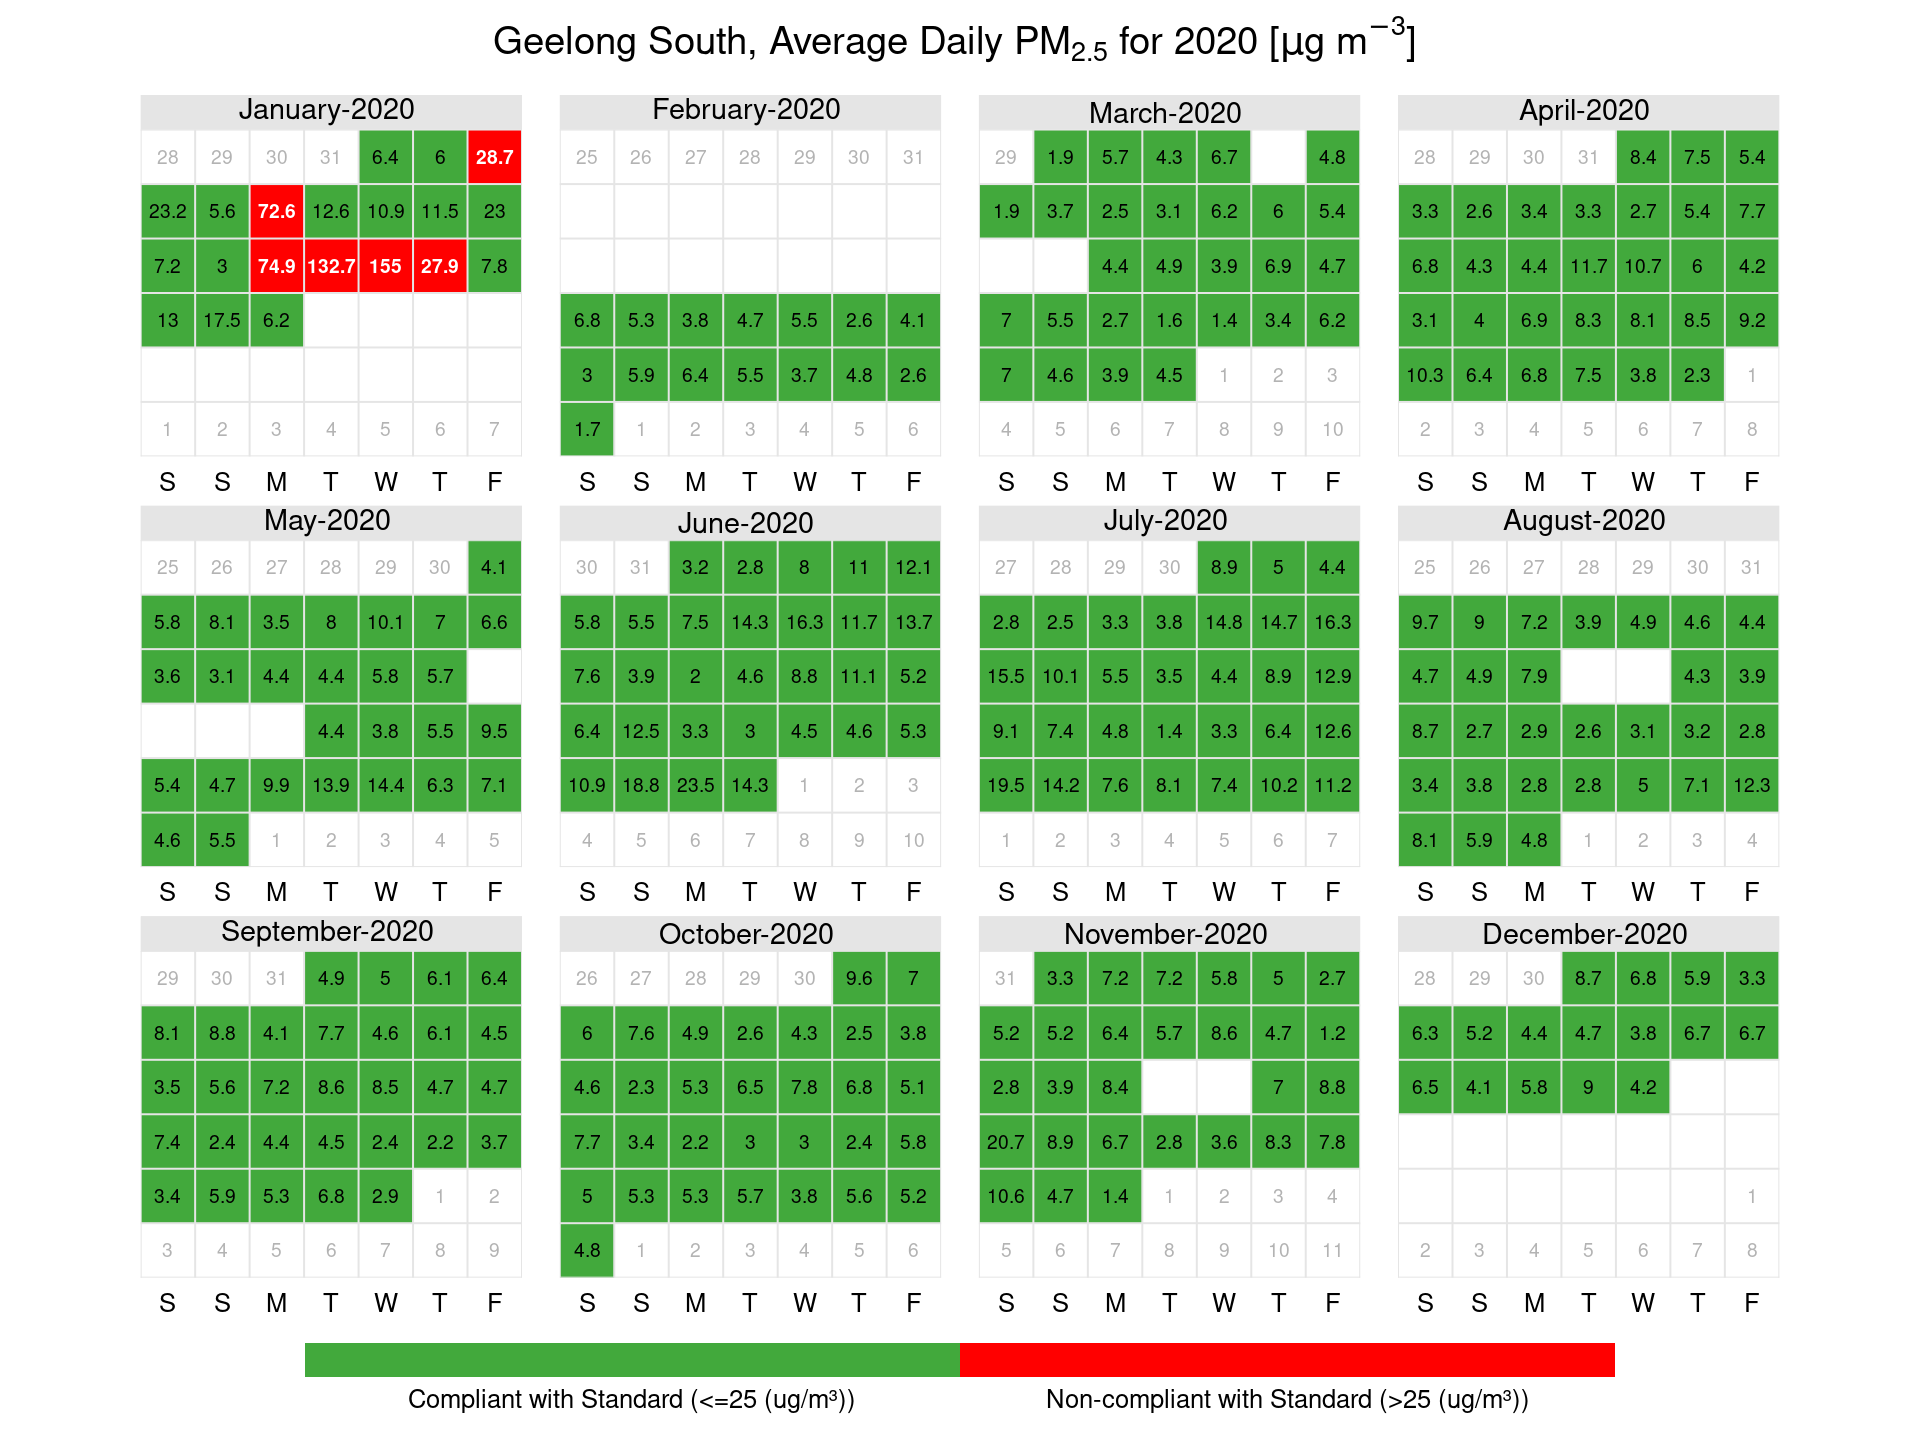
Figure 6: Melbourne CBD PM2.5 calendar plots showing days where exceedances of the average daily PM2.5 standard occurred in µg/m3
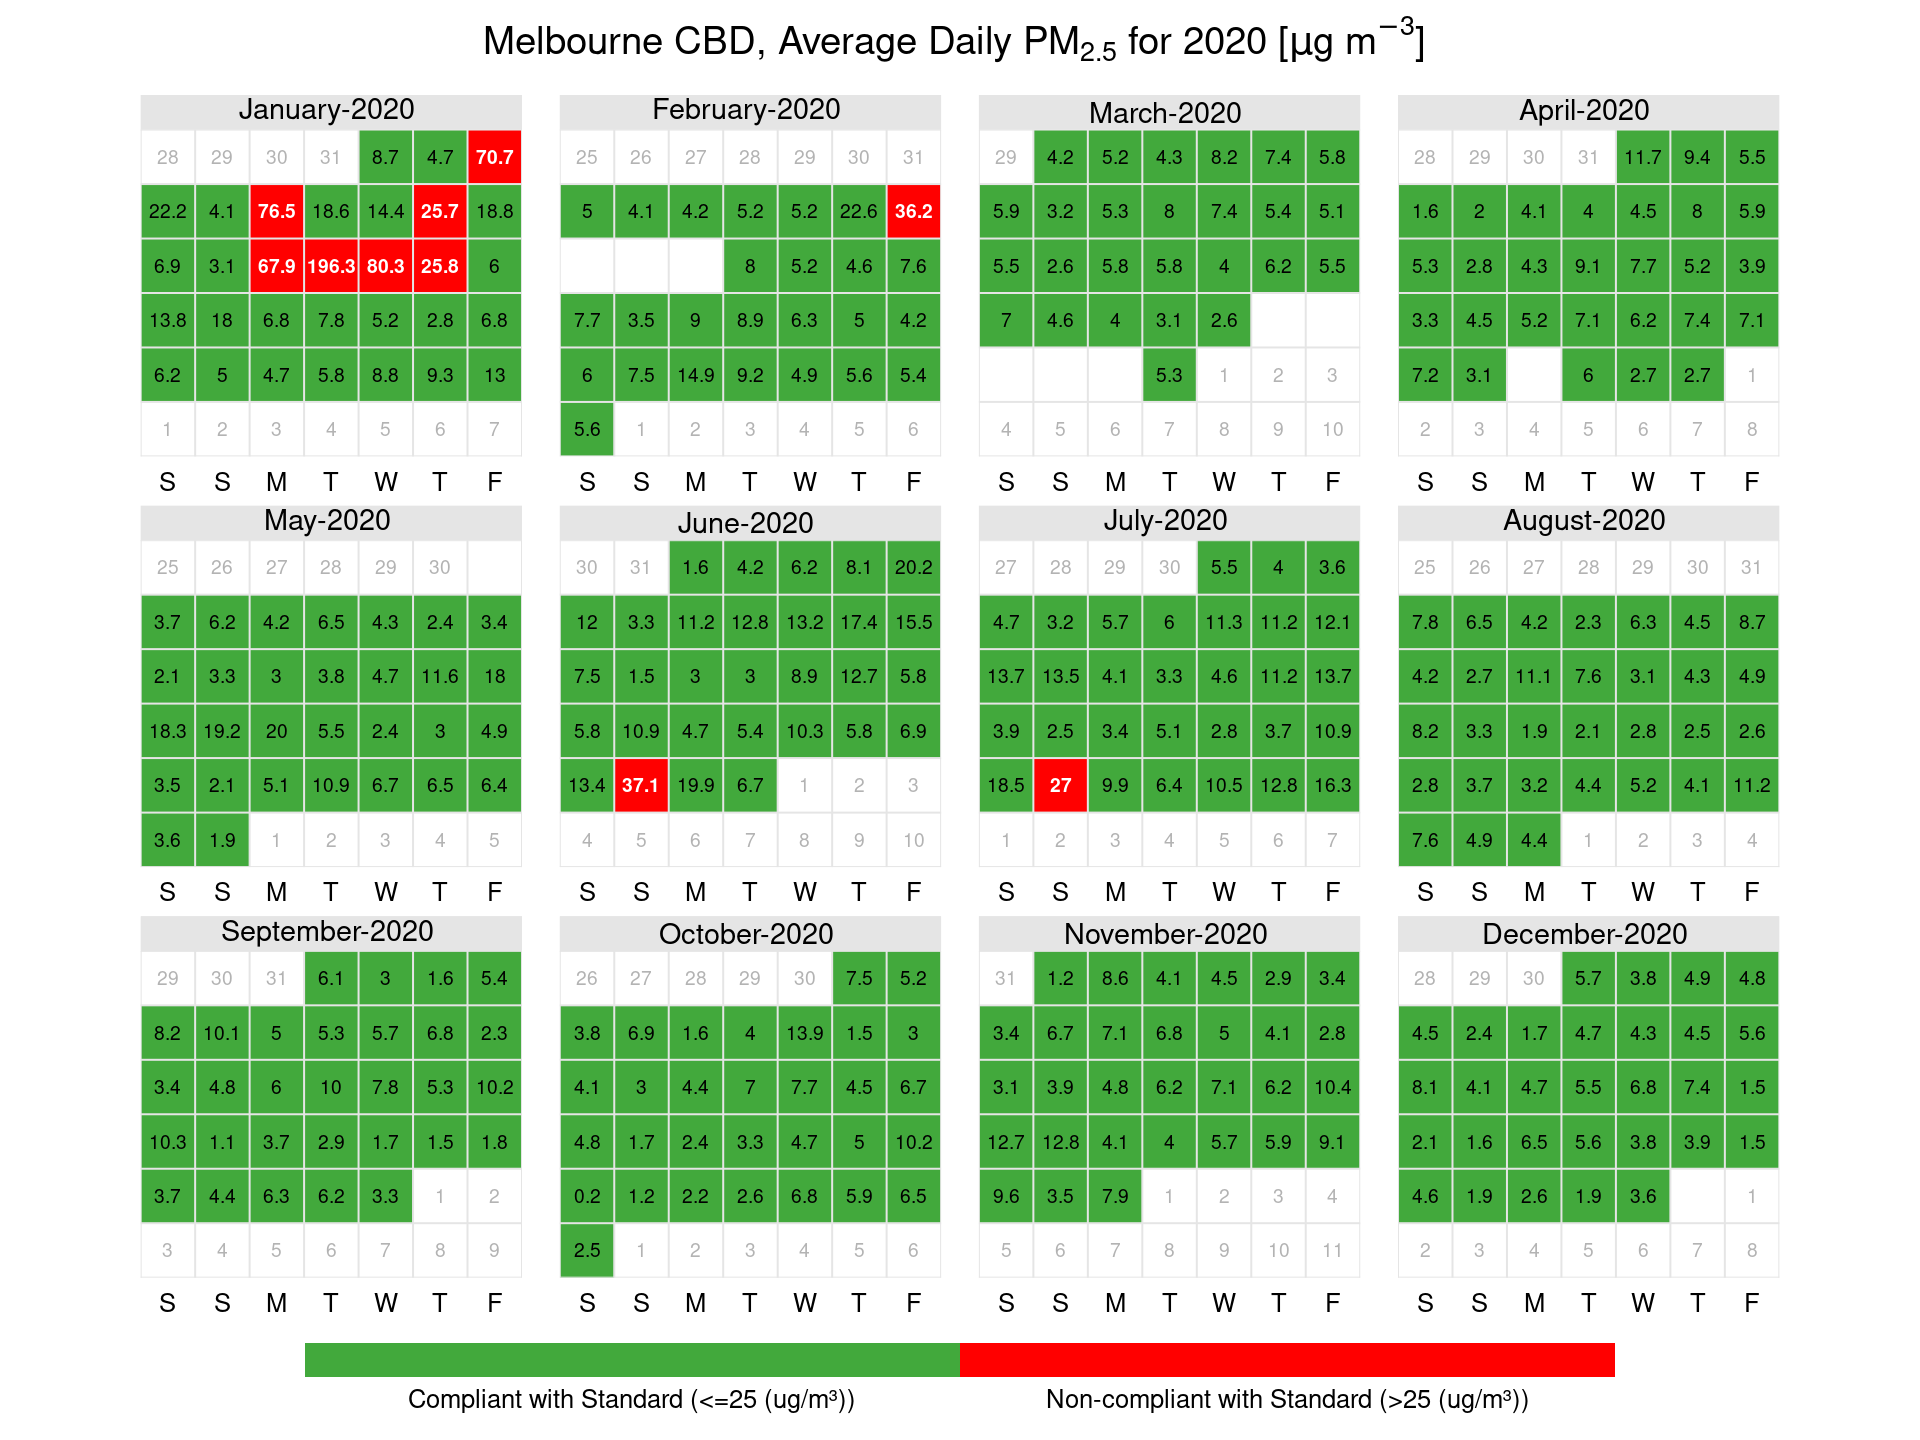
Figure 7: Traralgon PM2.5 calendar plots showing days where exceedances of the average daily PM2.5 standard occurred in µg/m3
3.2 Particles (PM10)
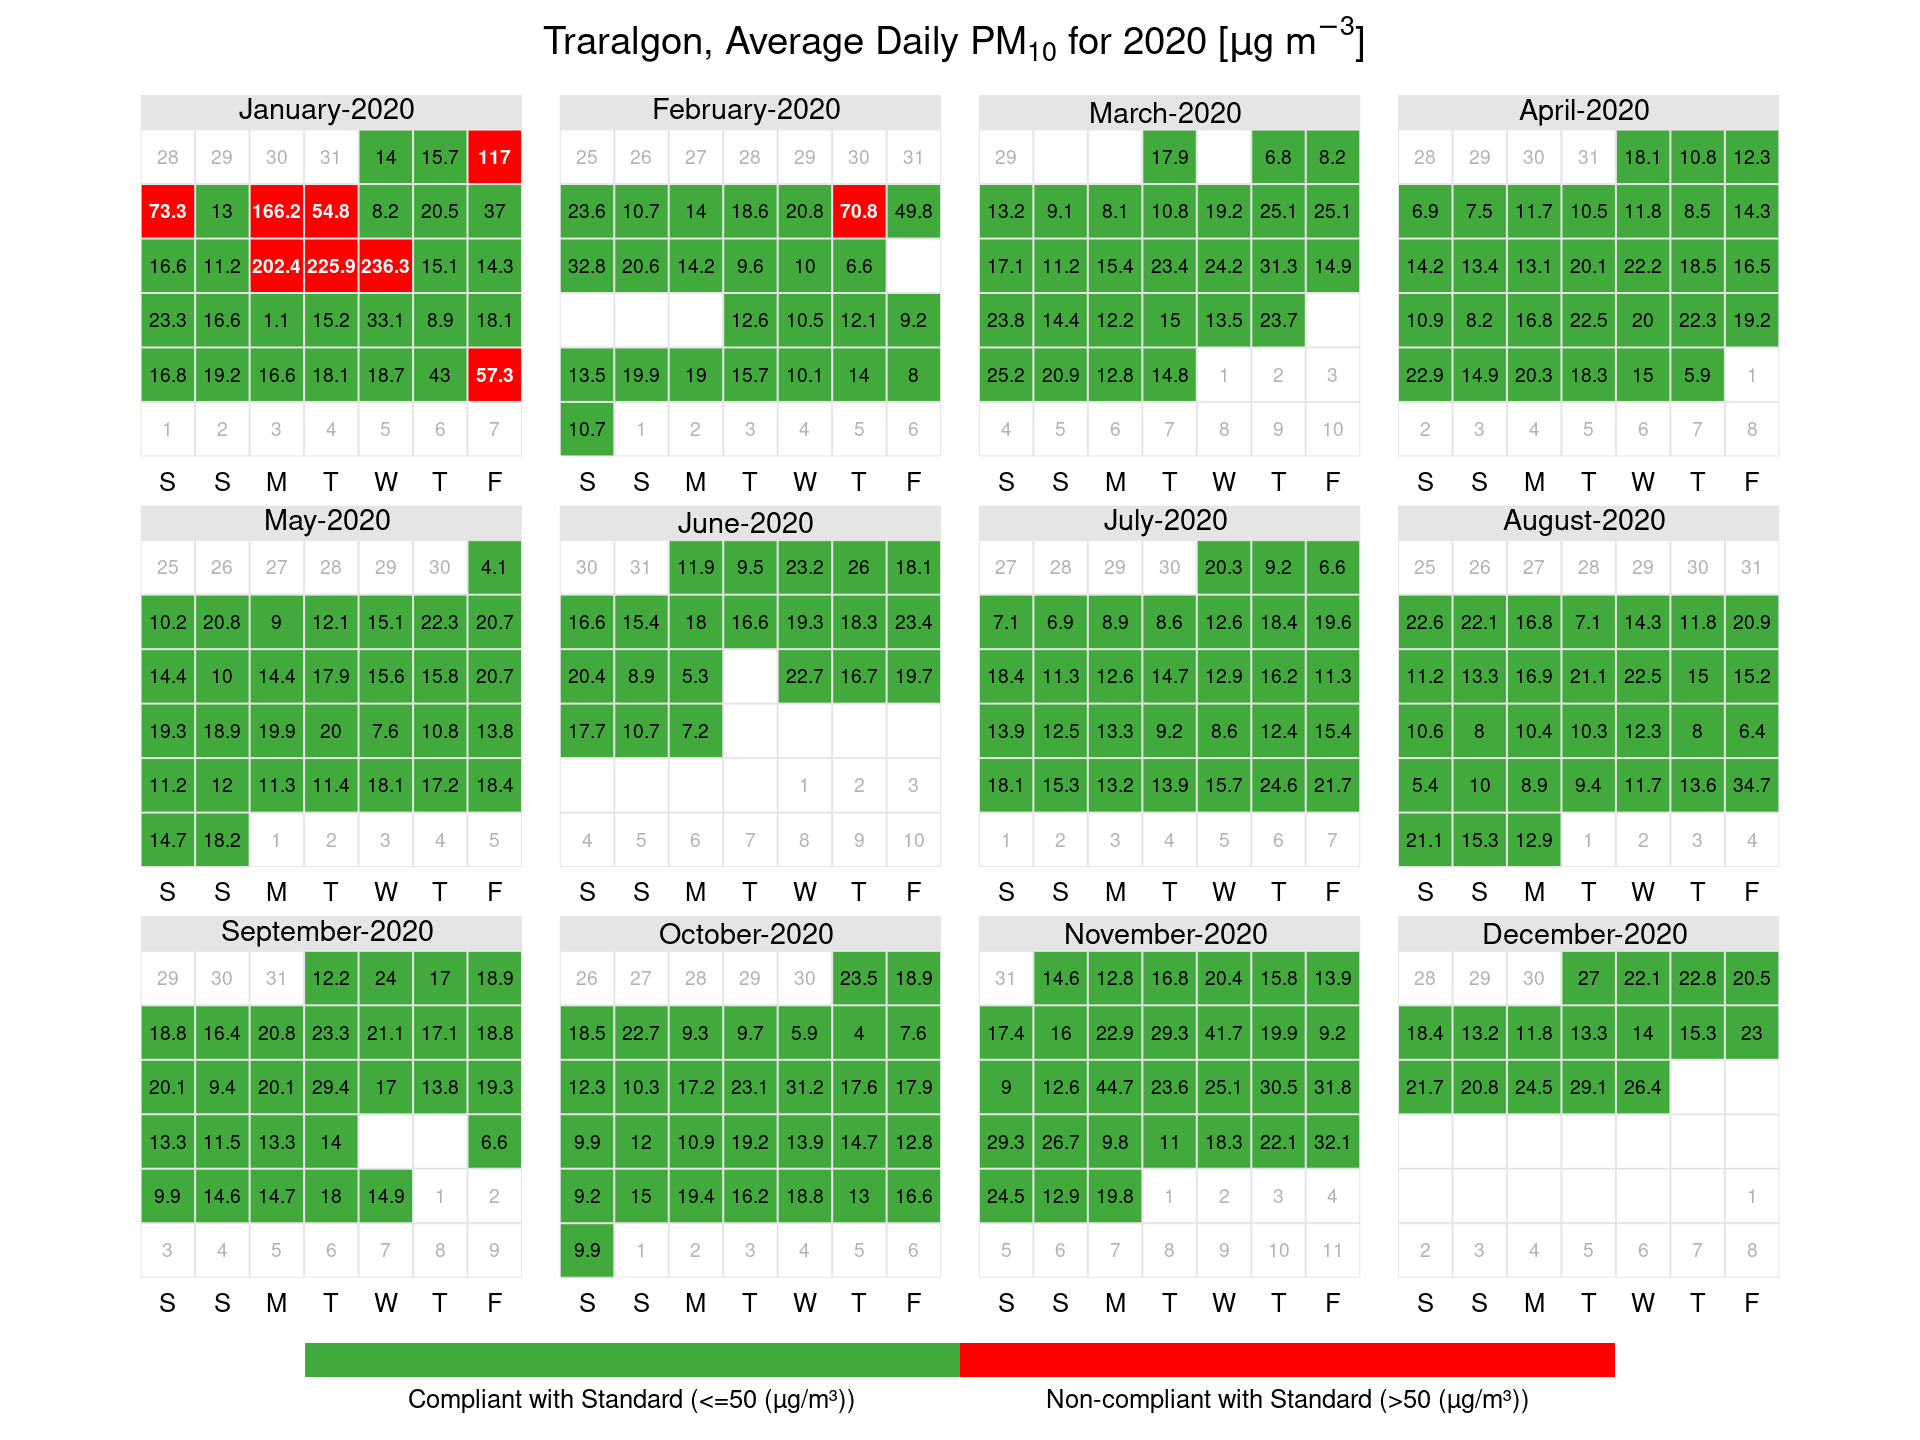
In 2020 the peak 24-hour PM10 measurement at a NEPM station was 259.12 µg/m3 at Dandenong on 14 January 2020. Similar concentrations were also recorded at other Melbourne stations, however due to a sensor fault at Footscray, an exceedance was not recorded on this day. As shown in Figures 8 to 13, there were exceedances of the 24-hour standard recorded during the year. All but one exceedance of the standard for PM10 in 2020 occurred during January and February and were associated with the major bushfires that impacted the south east coast of Australia. One exceedance of the standard at Footscray in November 2020 was attributed to local dust sources.
Bushfires and continental scale dust storms are classified as exceptional events as per the definition in the Measure. In 2020 no exceedances were attributed to continental-scale dust storms.
Table 20: 24-hour PM10 percentiles for 2020
| (% days) | Max | 99th | 98th | 95th | 90th | 75th | 50th | |
|---|---|---|---|---|---|---|---|---|
| Alphington | 92.35 | 226.48 | 68.99 | 48.01 | 37.08 | 28.96 | 21.98 | 16.22 |
| Dandenong | 91.26 | 259.12 | 87.27 | 62.22 | 37.08 | 29.81 | 23.21 | 17.57 |
| Footscray | 87.43 | 50.95 | 36.12 | 35.46 | 31.24 | 25.93 | 20.96 | 15.45 |
| Geelong South | 69.4 | 199.41 | 143.66 | 61.38 | 40.11 | 32.17 | 25.35 | 17.96 |
| Mooroolbark | 89.07 | 76.06 | 51 | 38.43 | 31.01 | 23.41 | 18.4 | 13.91 |
| Traralgon | 90.71 | 236.31 | 156.55 | 62.43 | 32.88 | 27.07 | 22.7 | 17.22 |
Figure 8: Alphington PM10 calendar plots showing days where exceedances of the average daily PM10 standard occurred in µg/m3
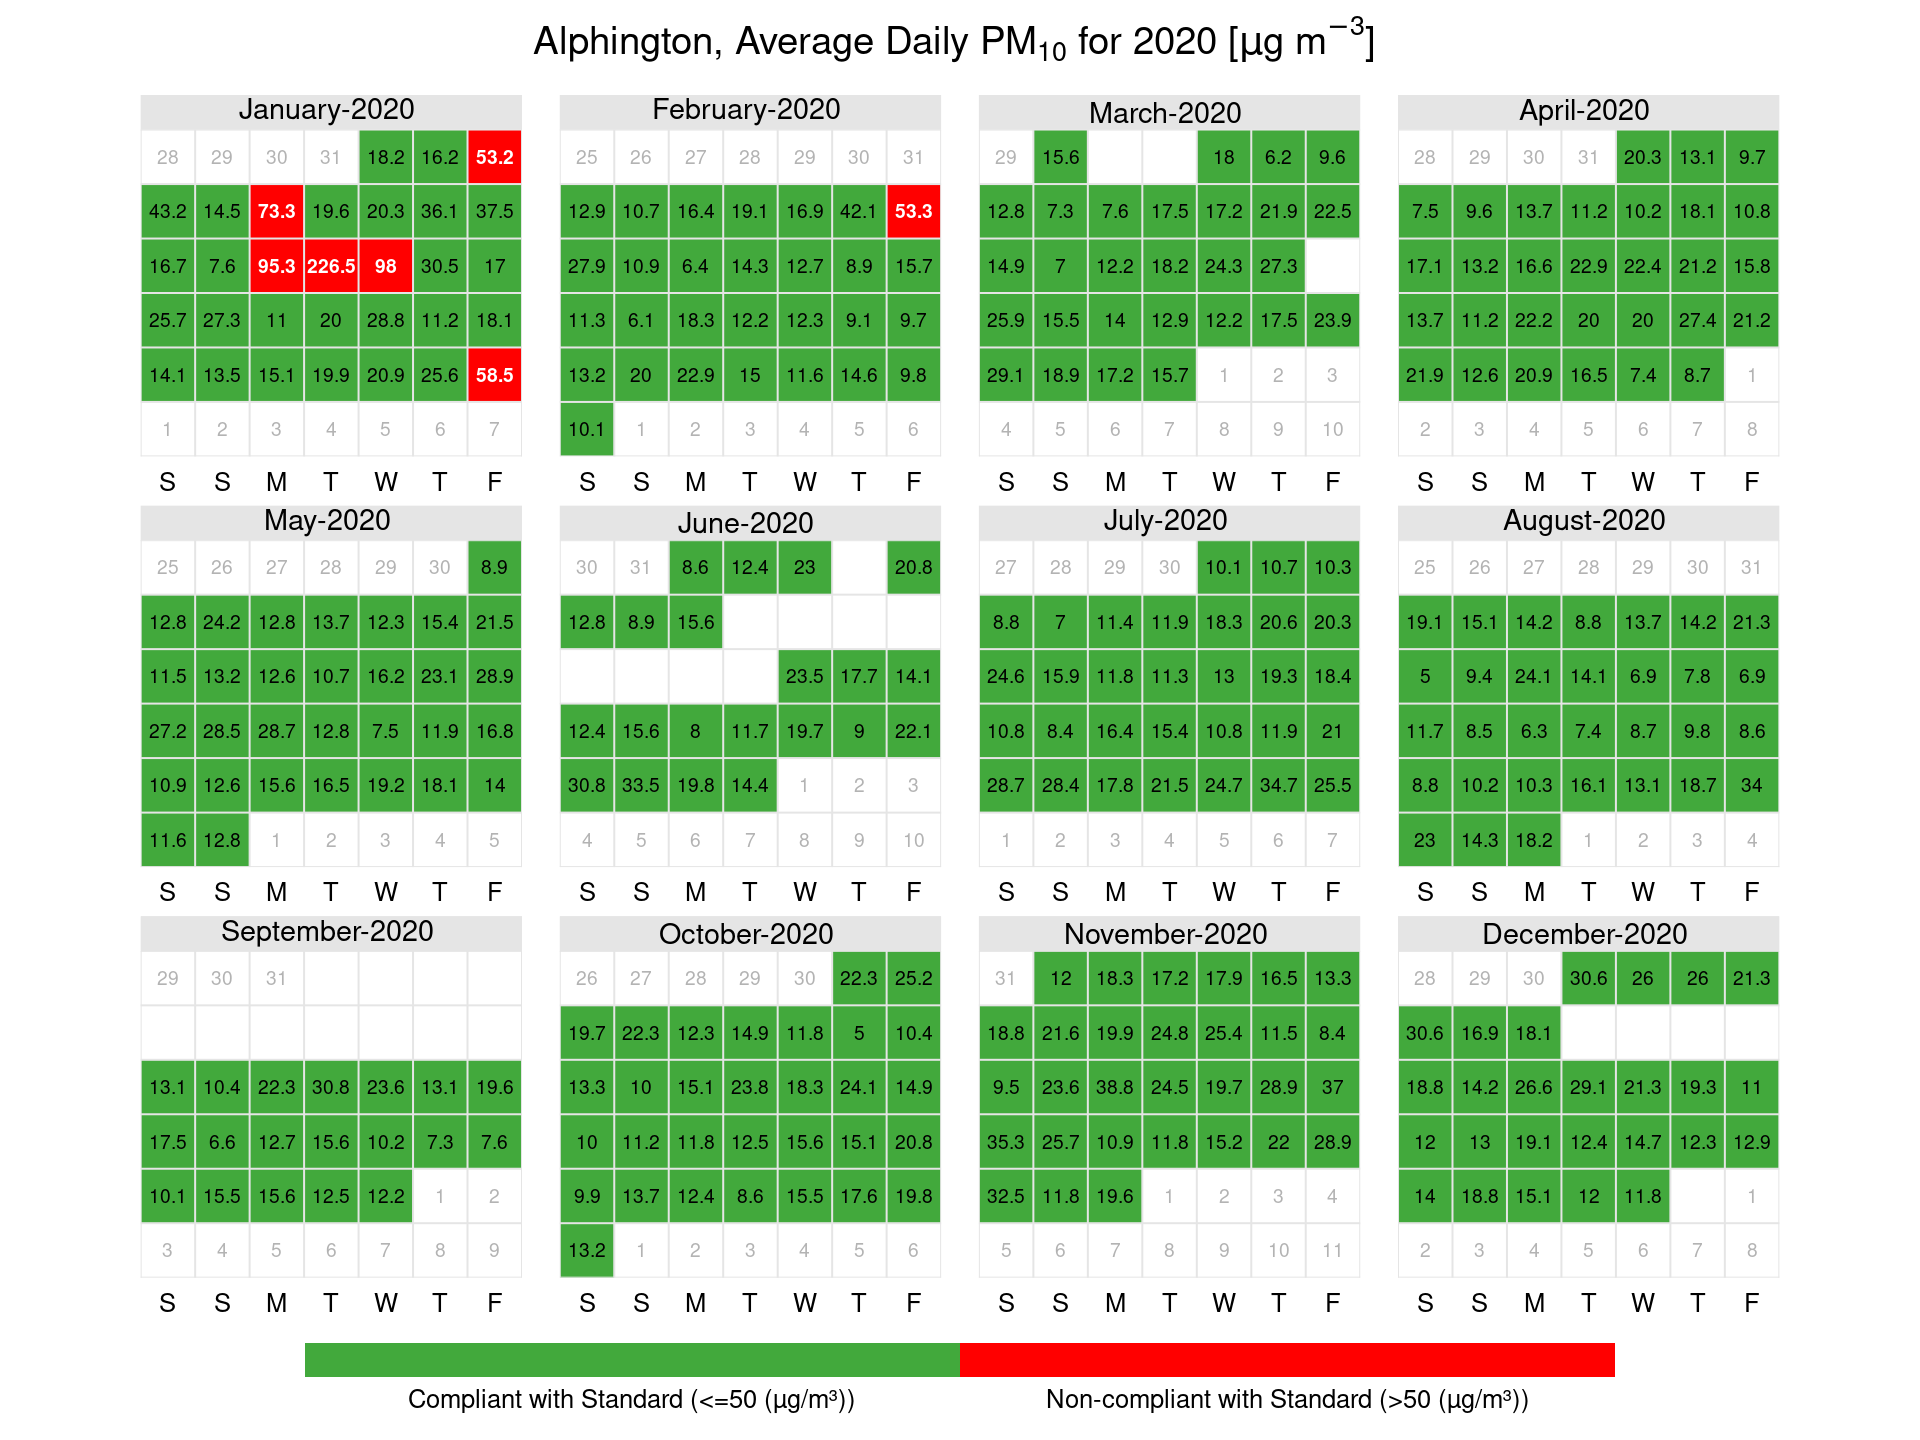
Figure 9: Dandenong PM10 calendar plots showing days where exceedances of the average daily PM10 standard occurred in µg/m3
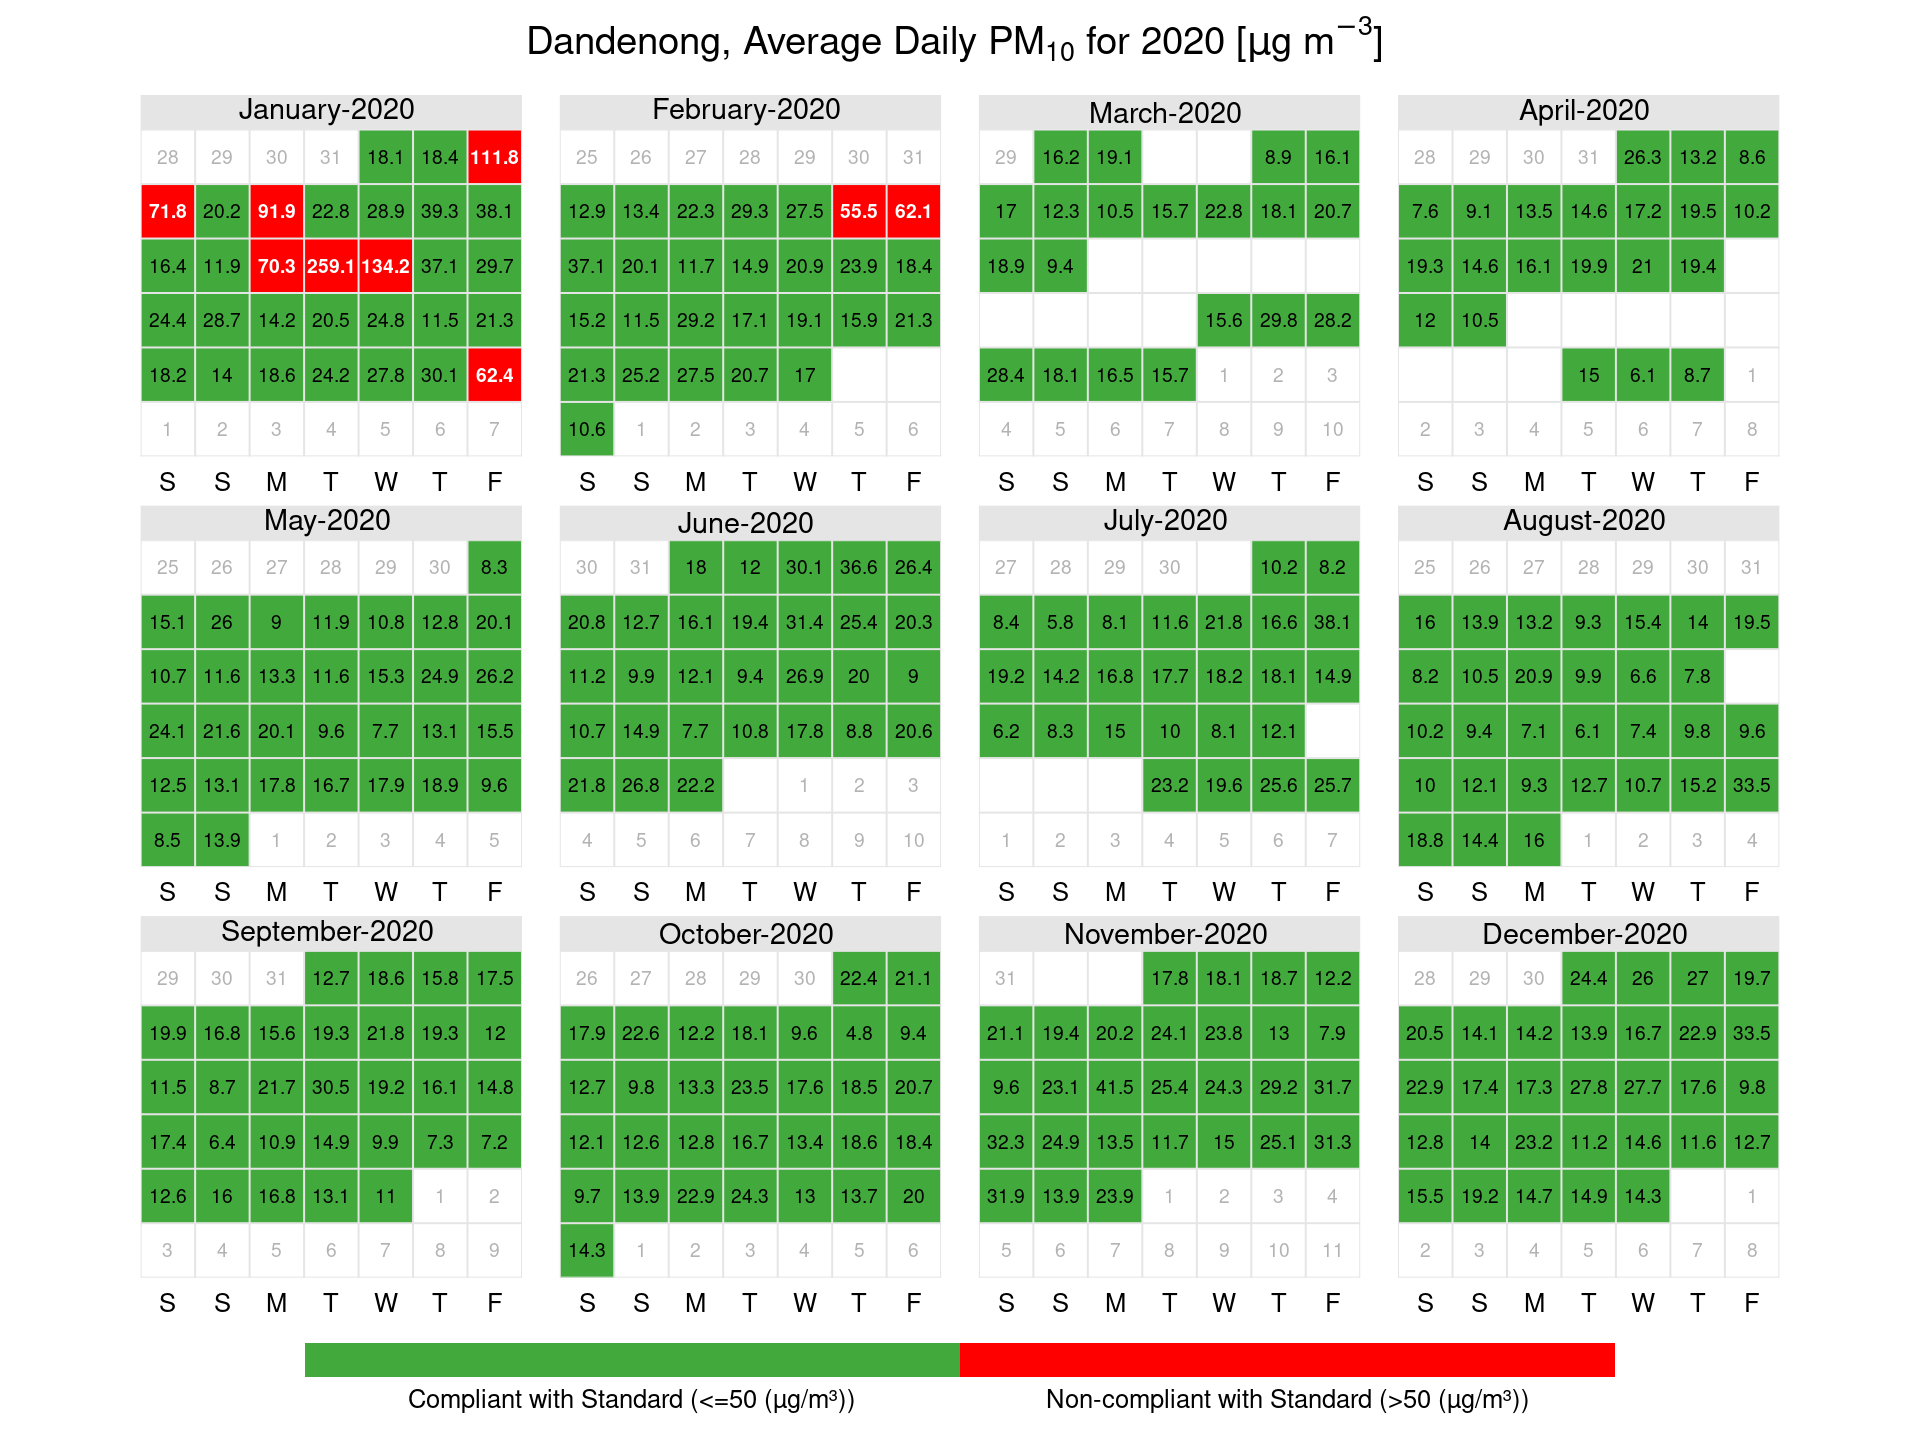
Figure 10: Footscray PM10 calendar plots showing days where exceedances of the average daily PM10 standard occurred in µg/m3
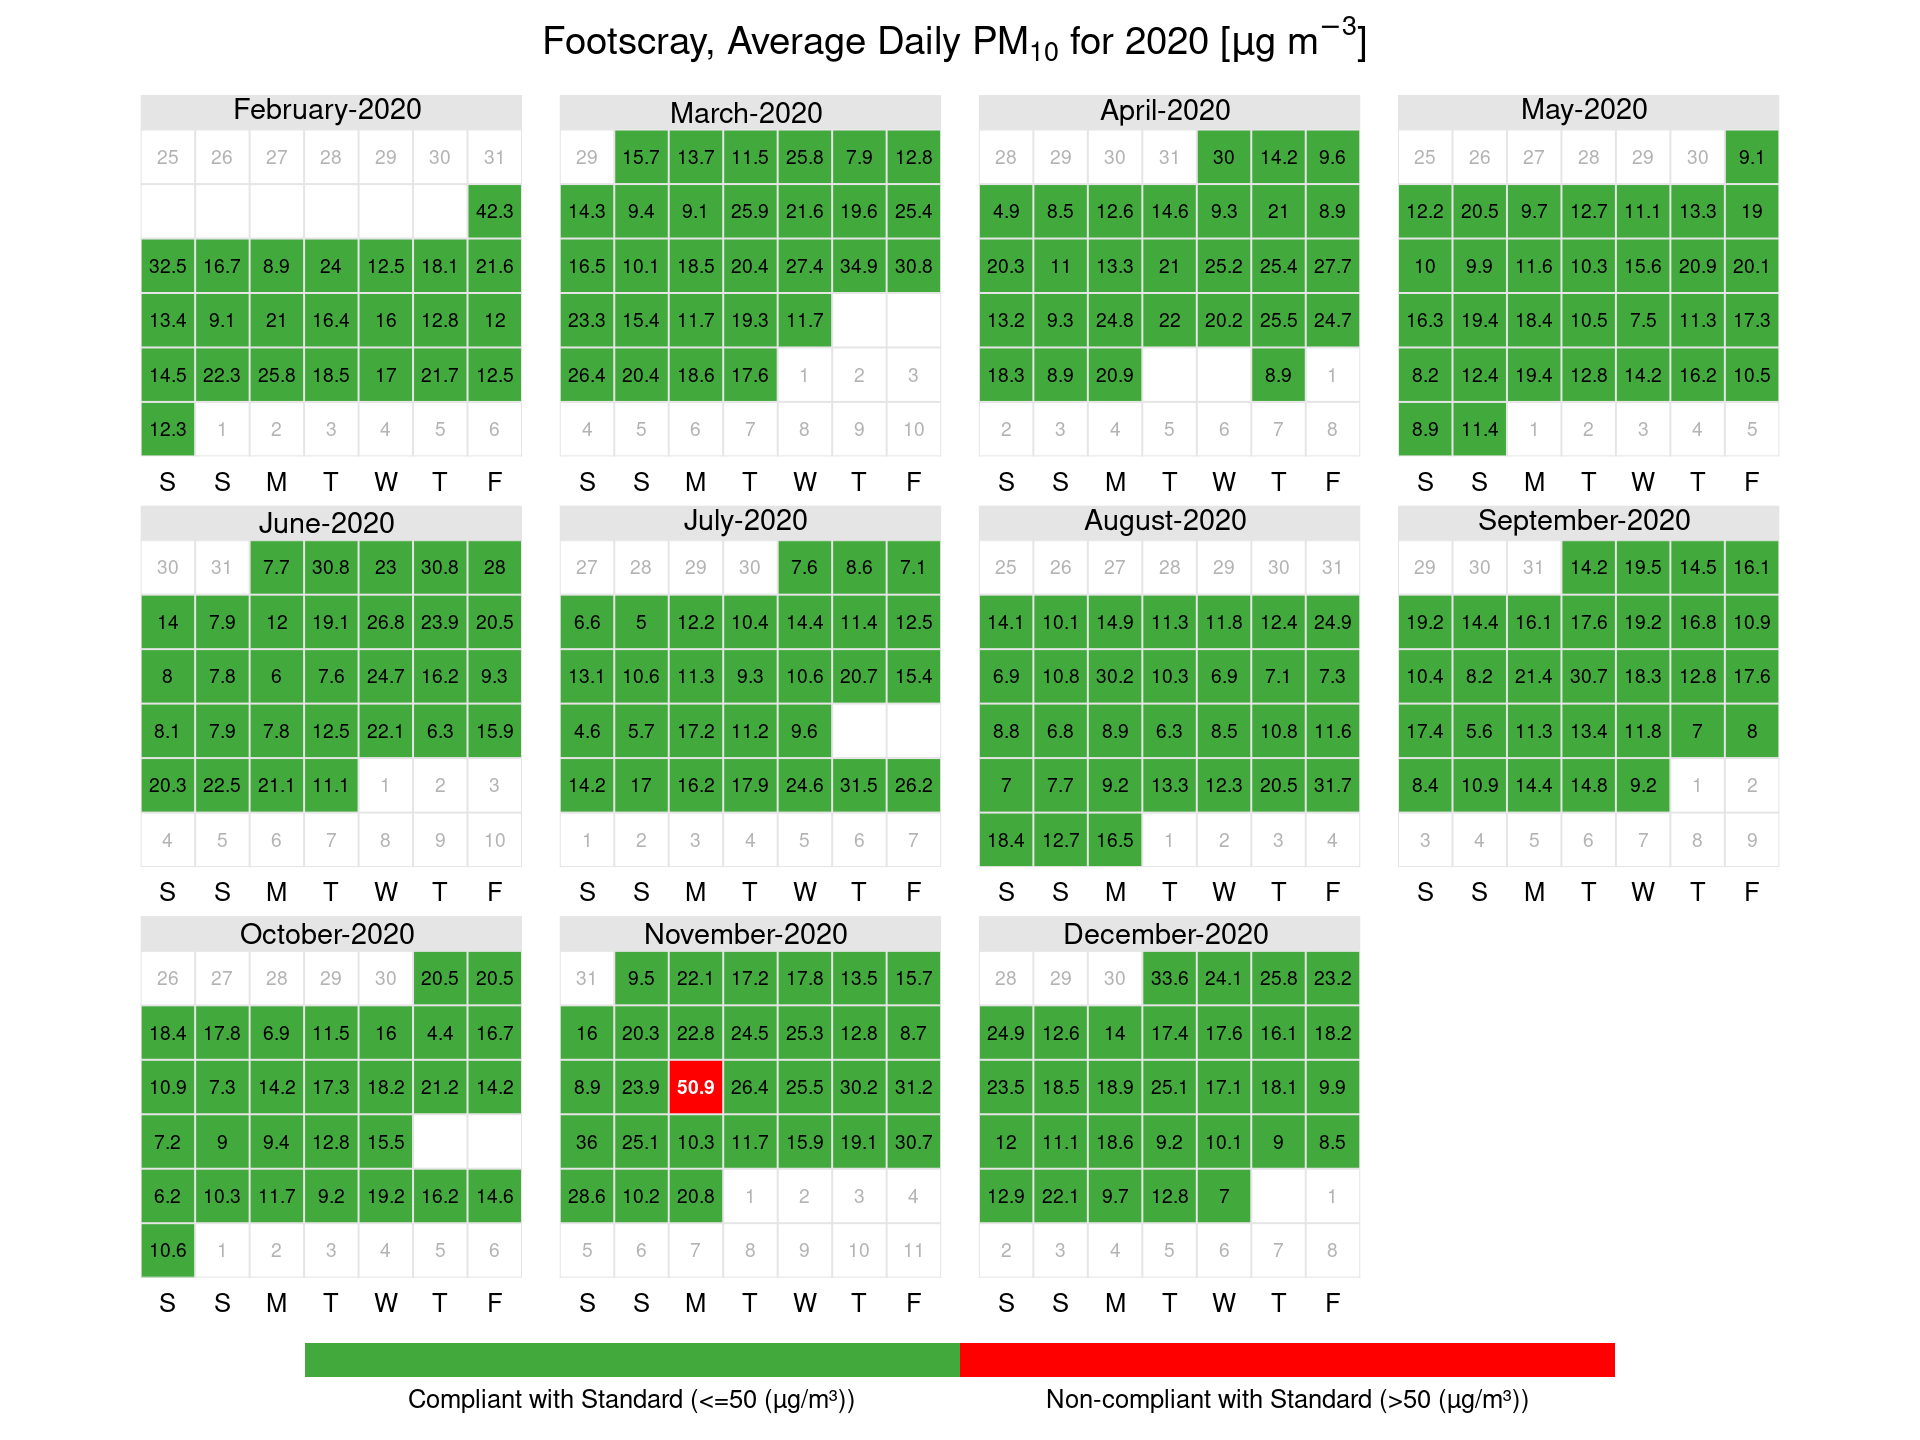
Figure 11: Geelong South PM10 calendar plots showing days where exceedances of the average daily PM10 standard occurred in µg/m3
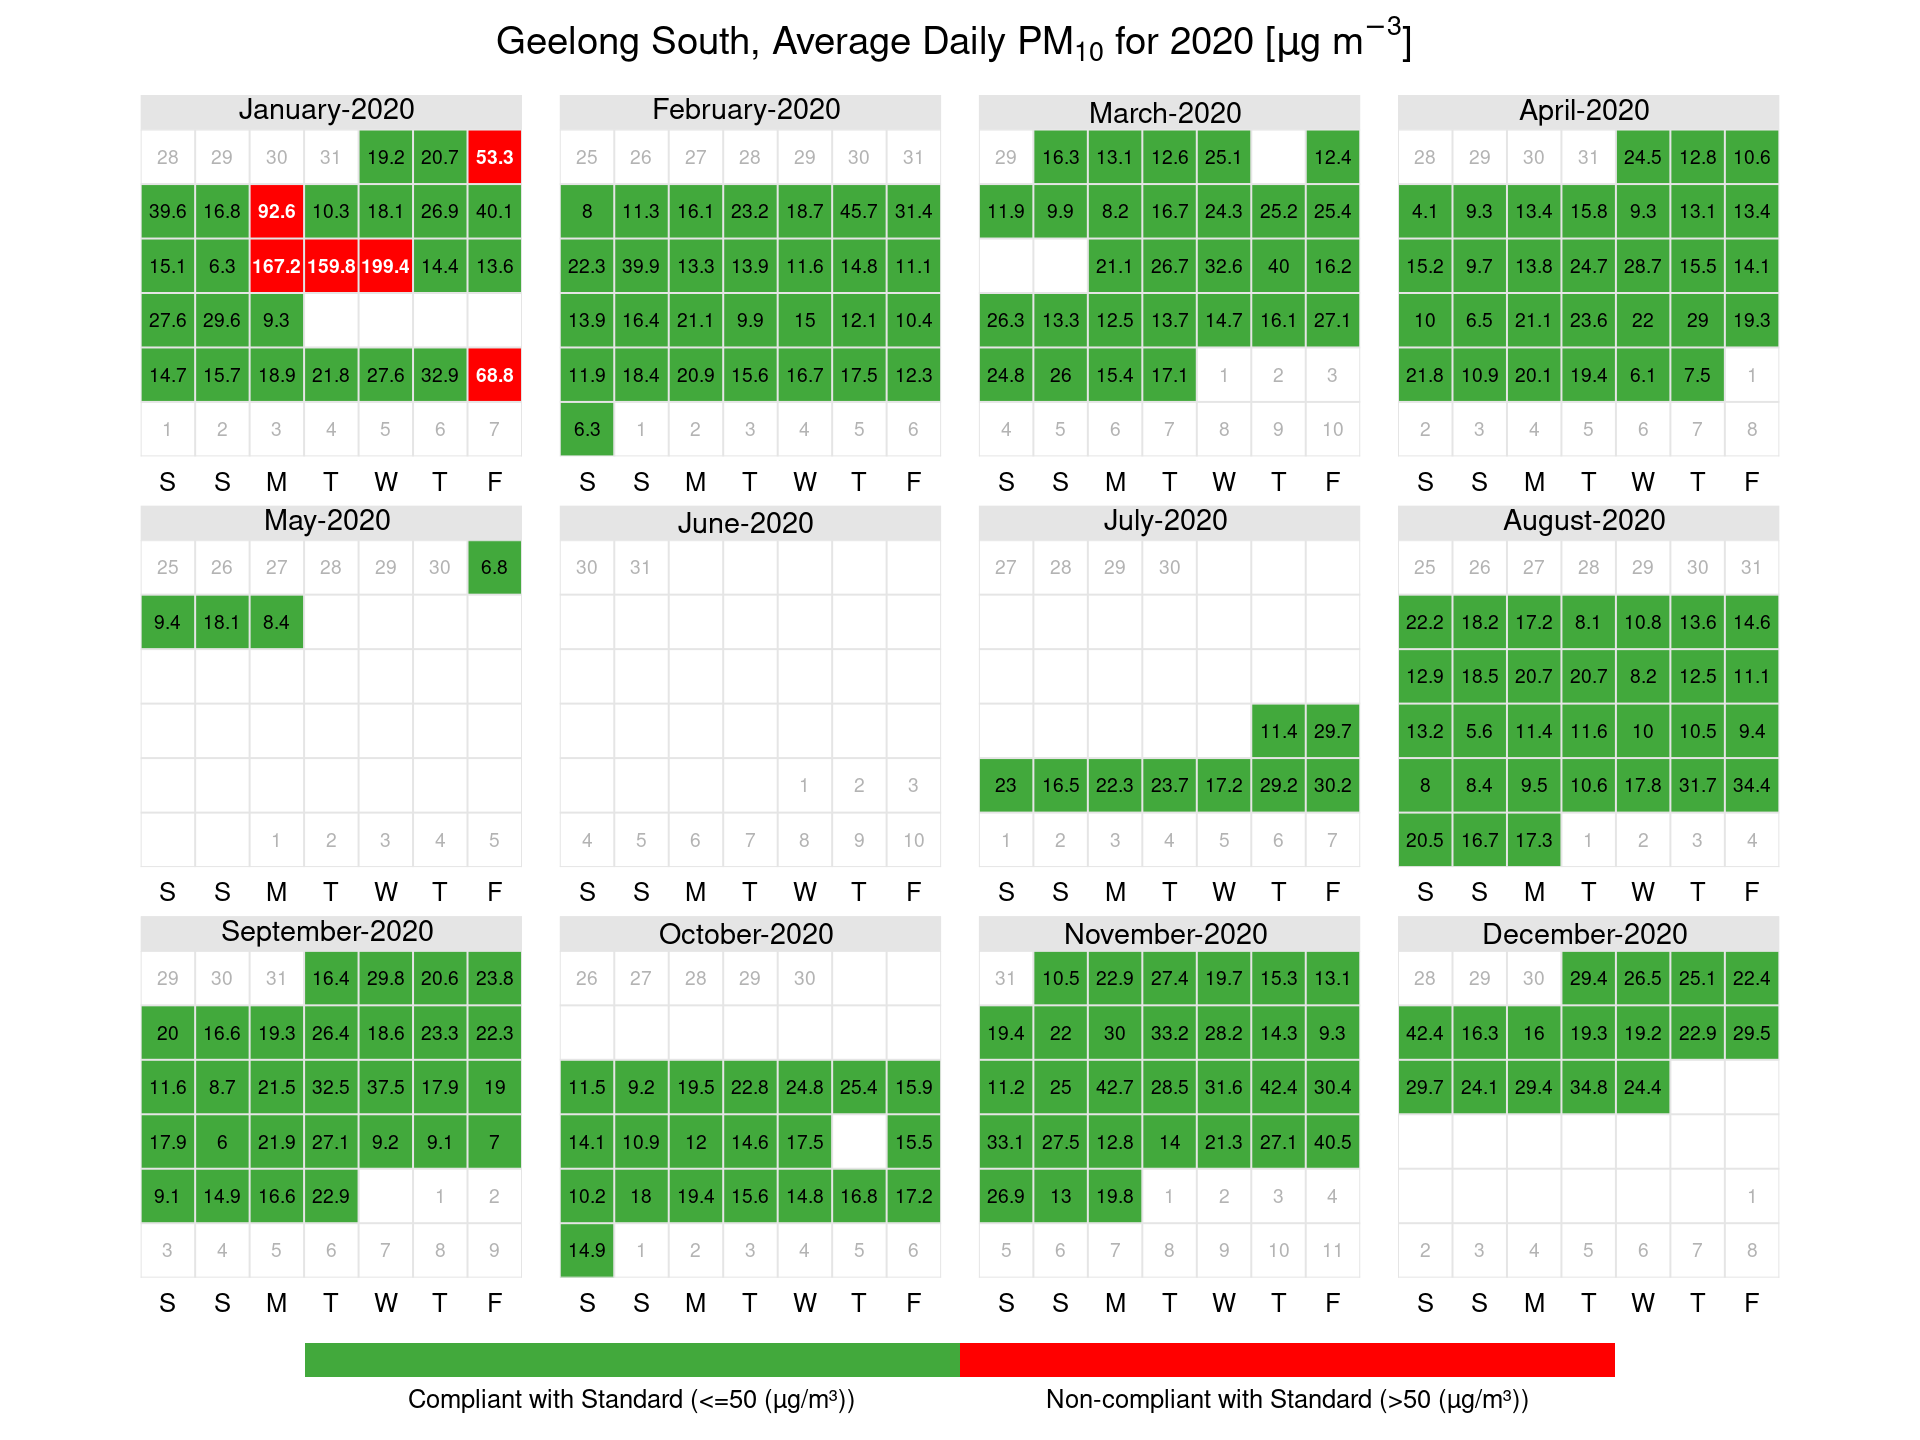
Figure 12: Mooroolbark PM10 calendar plots showing days where exceedances of the average daily PM10 standard occurred in µg/m3
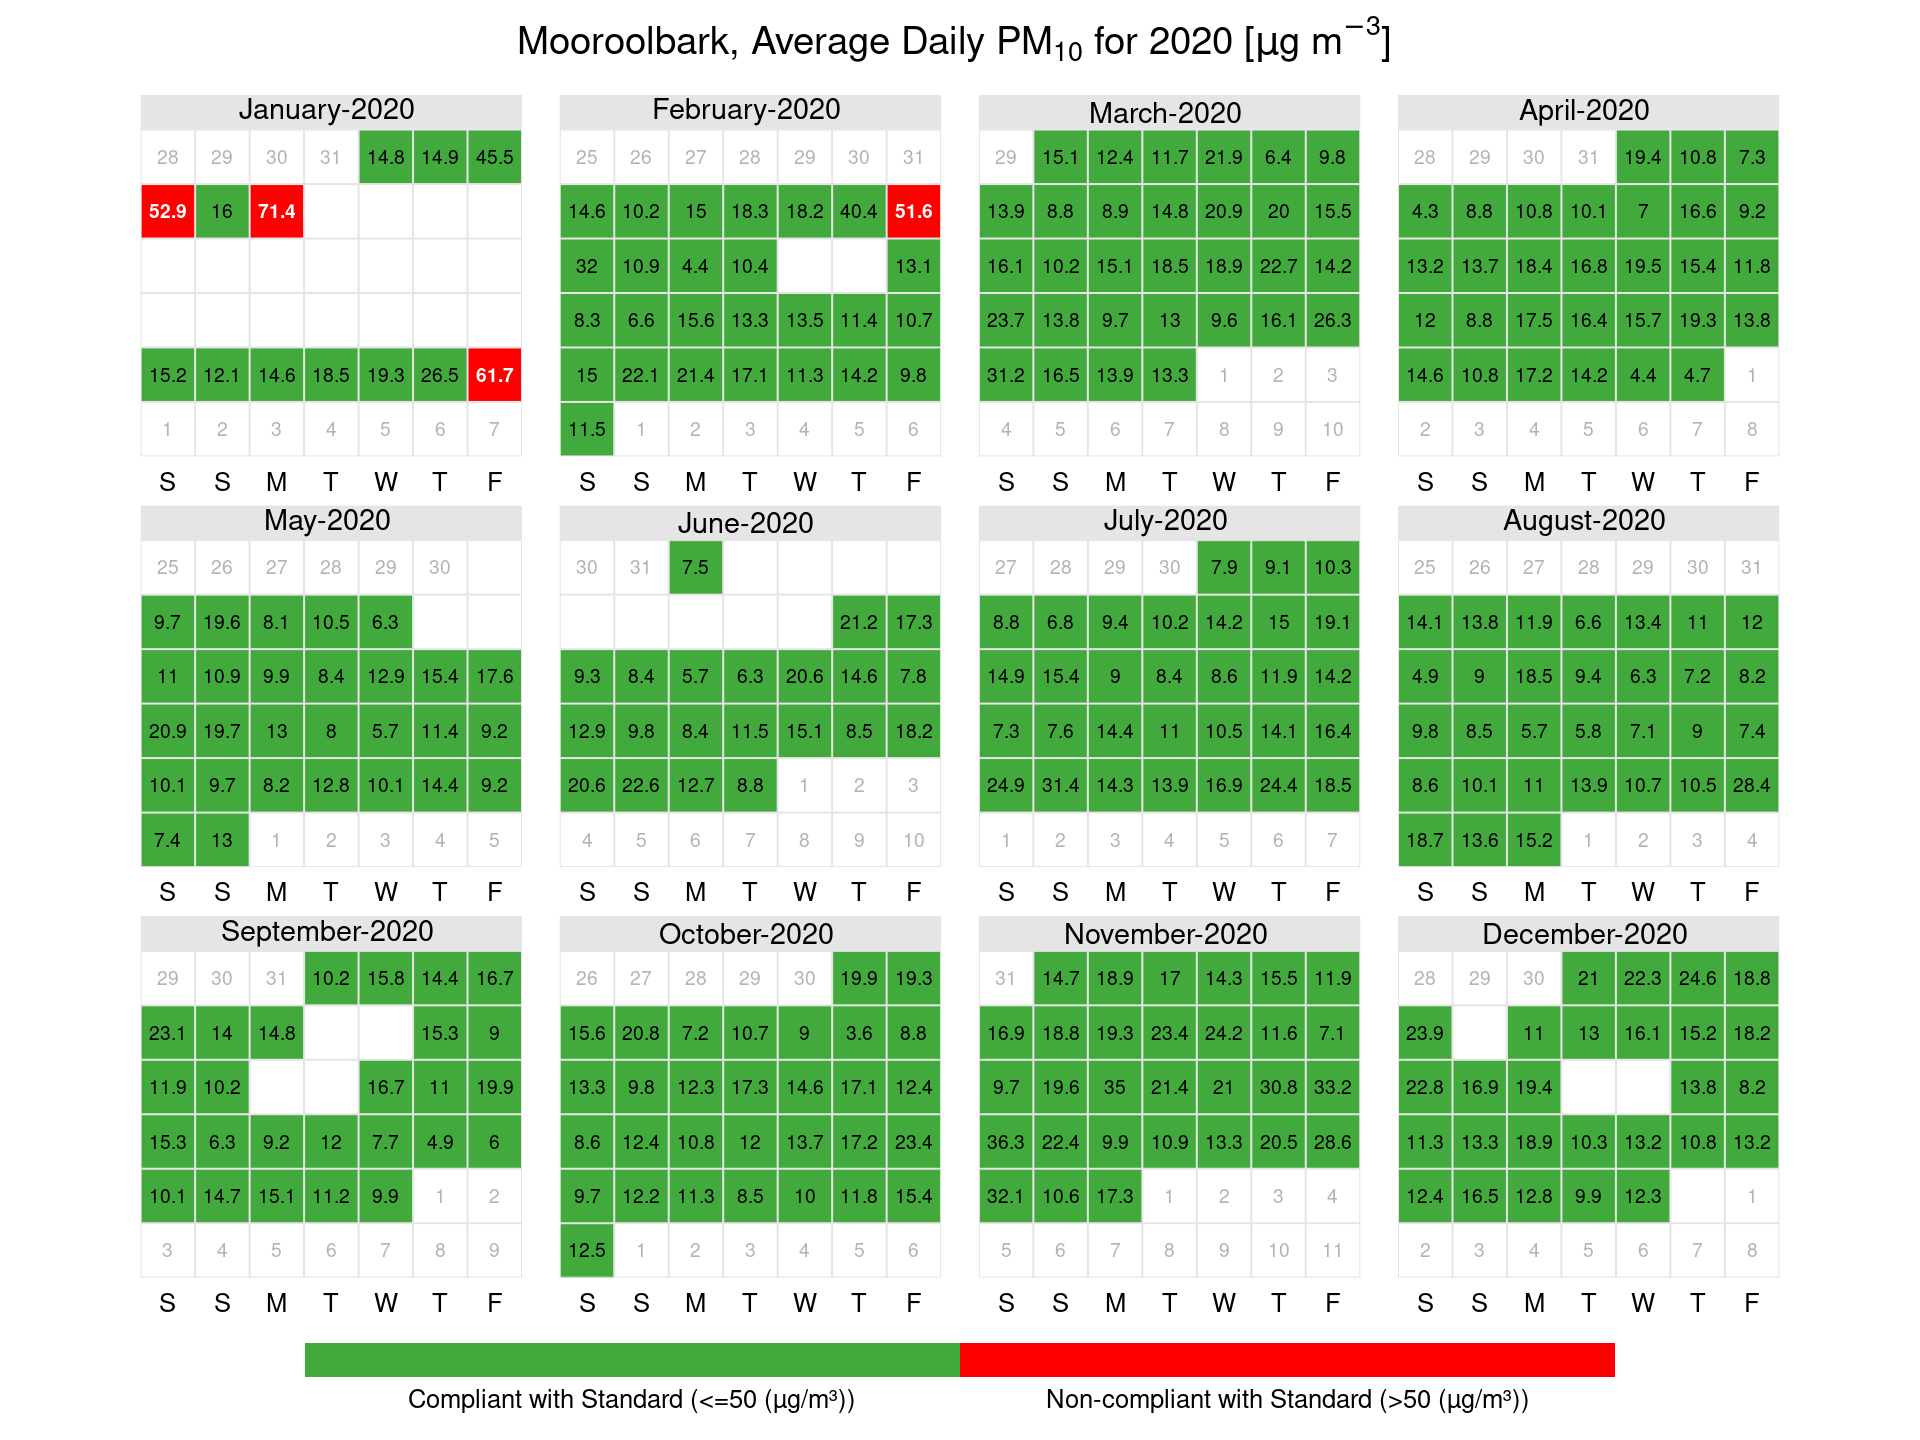
Figure 13: Traralgon PM10 calendar plots showing days where exceedances of the average daily PM10 standard occurred in µg/m3
3.3 Carbon monoxide (CO)
Percentiles of 2020 daily peak concentrations (over an eight-hour averaging period) are provided for carbon monoxide for each station in Table 21. Daily peak values are formed only when at least 75 per cent of the data for the day are valid. The percentiles for eight-hour carbon monoxide is based on rolling averages, including those that overlap from one day to the next.
Higher than usual maximum concentrations of carbon monoxide were recorded in 2020, this is likely to be due to significant bushfires that occurred in January. No exceedances of the standard were recorded in 2020.
Table 21: 8-hour carbon monoxide percentiles
| (% days) | Max | 99th | 98th | 95th | 90th | 75th | 50th | |
|---|---|---|---|---|---|---|---|---|
| Alphington | 88.52 | 2.25 | 1.35 | 1.21 | 0.99 | 0.74 | 0.41 | 0.22 |
| Footscray | 92.62 | 2.84 | 1.3 | 1.19 | 0.68 | 0.49 | 0.29 | 0.2 |
| Geelong South | 87.98 | 3.04 | 1.55 | 0.87 | 0.62 | 0.47 | 0.26 | 0.19 |
| Traralgon | 87.16 | 4.94 | 2.59 | 1.24 | 0.87 | 0.69 | 0.49 | 0.22 |
3.4 Nitrogen dioxide (NO2)
Percentiles of 2020 daily peak concentrations (over an one-hour averaging period) are provided for nitrogen dioxide for each station in Table 22. Daily peak values are formed only when at least 75 per cent of the data for the day are valid.
There were no exceedances of the nitrogen dioxide standard recorded in 2020.
Table 22: One-hour nitrogen dioxide percentiles
| (% days) | Max | 99th | 98th | 95th | 90th | 75th | 50th | |
|---|---|---|---|---|---|---|---|---|
| Alphington | 95.08 | 51.5 | 34.76 | 32.54 | 31.46 | 29.1 | 23.52 | 17.1 |
| Footscray | 97.81 | 64.8 | 39.53 | 37.84 | 35.23 | 32.43 | 26.67 | 19.2 |
| Geelong South | 93.44 | 52.8 | 41.79 | 35.12 | 28.4 | 25.99 | 21.17 | 13.85 |
| Traralgon | 92.9 | 32 | 27.86 | 26.84 | 25.01 | 22.9 | 18.45 | 12.65 |
3.5 Ozone (O3)
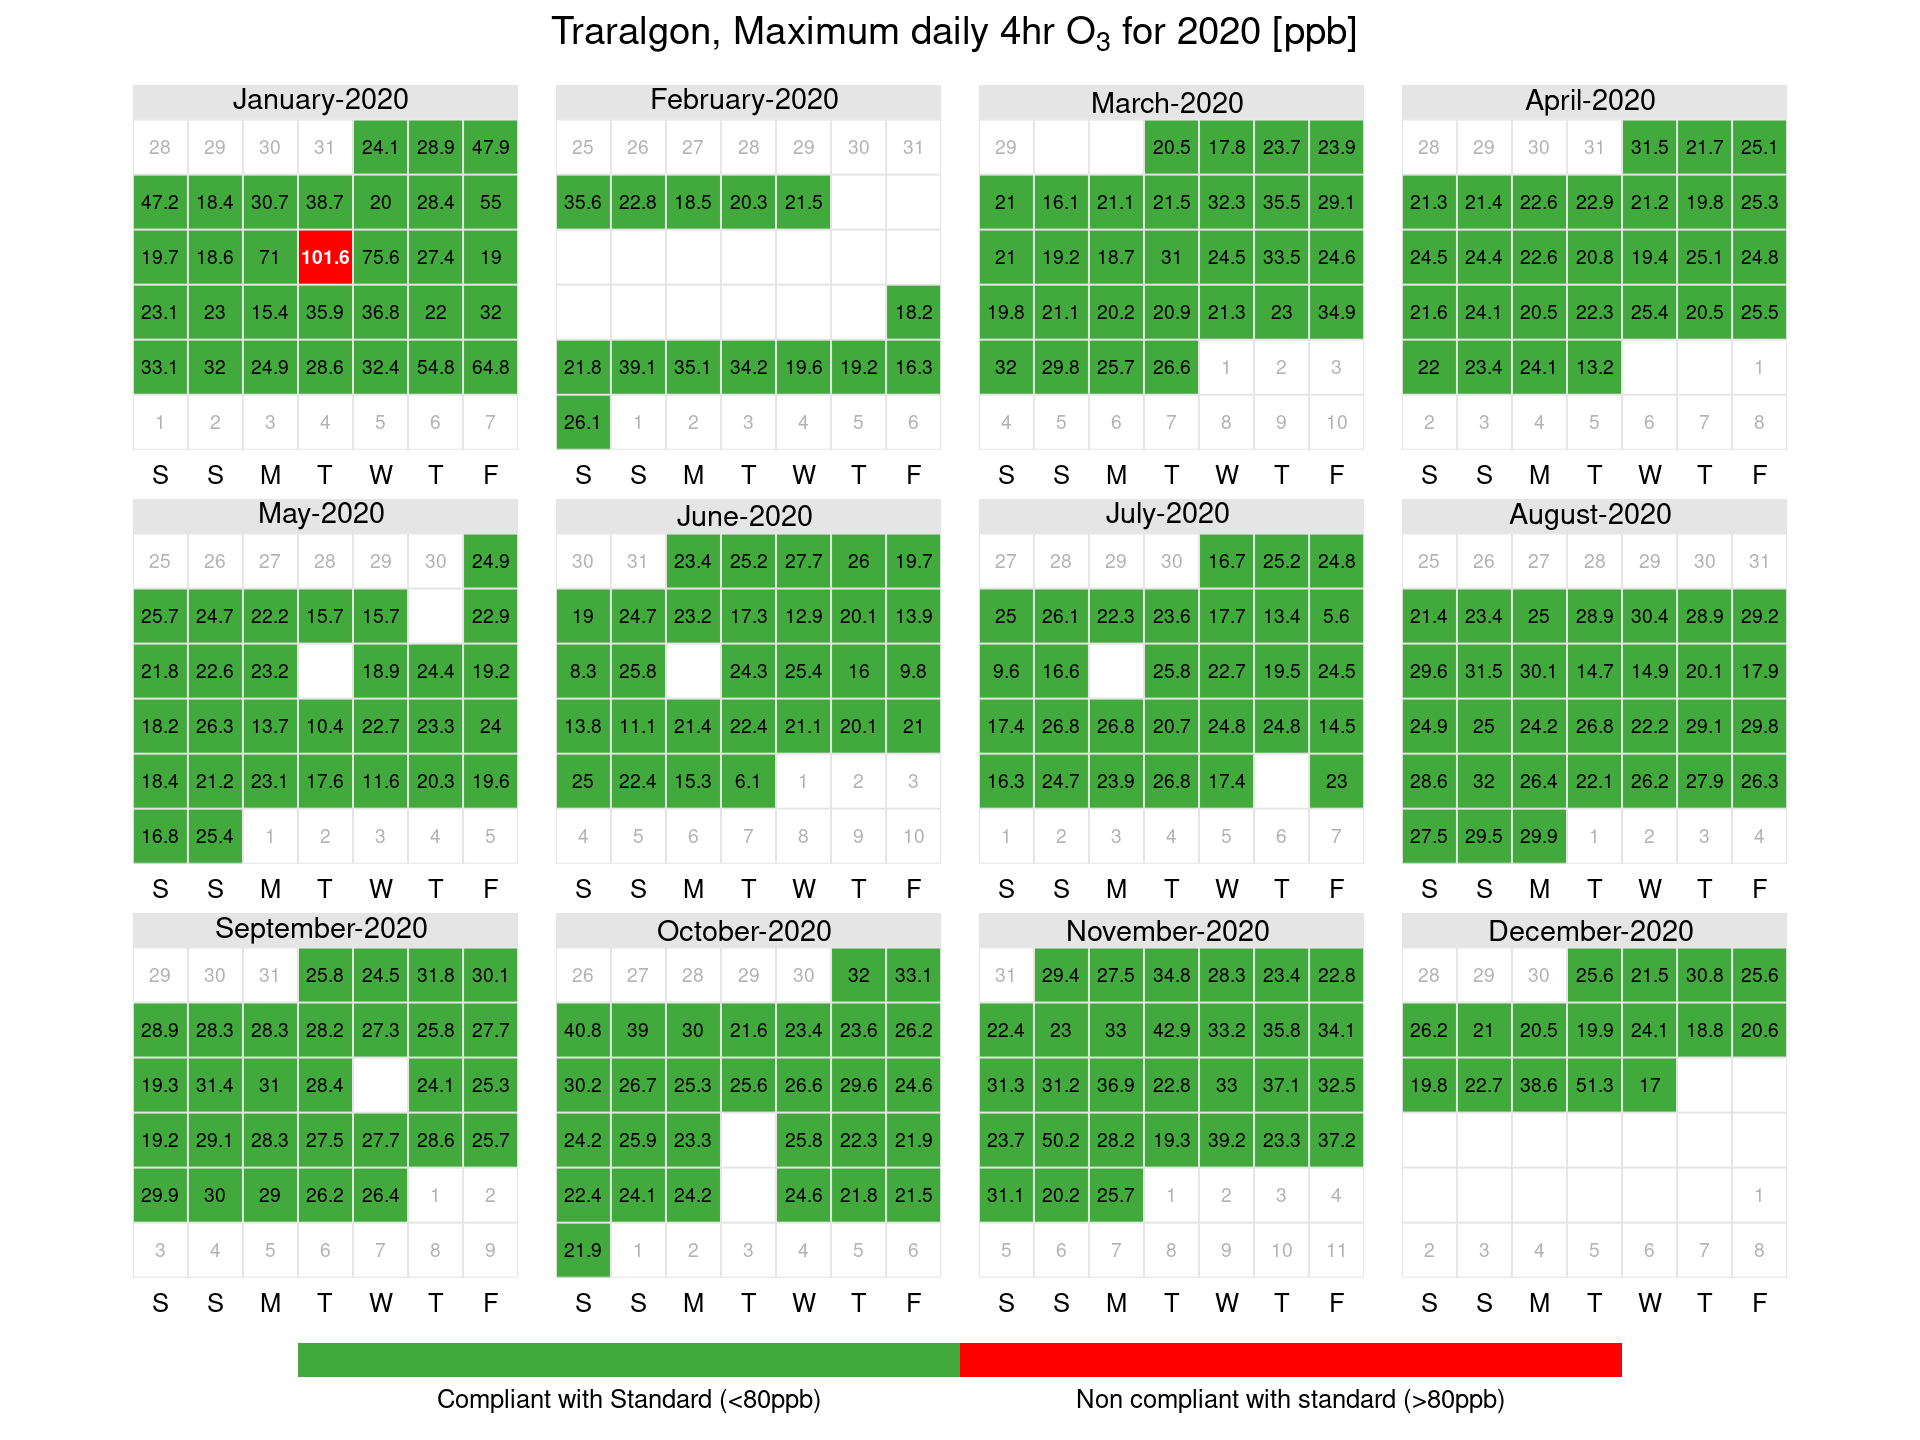
Percentiles of 2020 daily peak concentrations (over an one-hour and four-hour averaging periods) are provided for ozone for each station and standard in Tables 23 and Table 24. Daily peak values are formed only when at least 75 per cent of the data for the day are valid. The percentiles for four-hour ozone is based on rolling averages, including those that overlap from one day to the next.
In 2020 there were several exceedances of the ozone standard recorded in January 2020. These were associated with the major bushfires which impacted south east Australia.
Table 23: One-hour ozone percentiles
| (% days) | Max | 99th | 98th | 95th | 90th | 75th | 50th | |
|---|---|---|---|---|---|---|---|---|
| Alphington | 94.81 | 129.2 | 74.13 | 65.4 | 47.24 | 37.76 | 30.75 | 25.9 |
| Dandenong | 98.09 | 110.9 | 74.79 | 55.29 | 43.11 | 36.74 | 30.5 | 26.4 |
| Footscray | 98.09 | 117.1 | 72.78 | 62.64 | 43.73 | 35.52 | 29.15 | 25.7 |
| Geelong South | 93.72 | 113.9 | 73.96 | 51.87 | 44.4 | 35 | 29.9 | 27.1 |
| Melton | 95.08 | 128.3 | 74.42 | 62.75 | 46.62 | 38.48 | 32.12 | 28.7 |
| Point Cook | 59.56 | 55.6 | 49.96 | 46.97 | 41.32 | 35.96 | 32.08 | 29.8 |
| Traralgon | 89.89 | 107.5 | 70.79 | 56.07 | 40.94 | 35.8 | 29.8 | 25.5 |
Table 24: 4-hour ozone percentiles
| (% days) | Max | 99th | 98th | 95th | 90th | 75th | 50th | |
|---|---|---|---|---|---|---|---|---|
| Alphington | 92.9 | 119.15 | 71.57 | 59.18 | 43.09 | 36.14 | 29.41 | 24.89 |
| Dandenong | 96.99 | 98 | 69.13 | 50.81 | 39.82 | 34.27 | 29.86 | 25.2 |
| Footscray | 96.45 | 108.38 | 68.98 | 57.61 | 40.14 | 34 | 28.27 | 24.27 |
| Geelong South | 93.44 | 95.5 | 63.42 | 48.29 | 40.6 | 33.67 | 28.95 | 25.89 |
| Melton | 93.99 | 119.35 | 67.63 | 60.43 | 43.69 | 36.67 | 31.61 | 27.86 |
| Point Cook | 59.29 | 50.55 | 46.3 | 43.44 | 38.78 | 34.58 | 31.38 | 29.02 |
| Traralgon | 88.52 | 101.55 | 62.56 | 50.8 | 38.43 | 33.08 | 28.44 | 24.36 |
Figure 14: Alphington ozone calendar plots showing days where exceedances of the maximum daily standard occurred in ppb
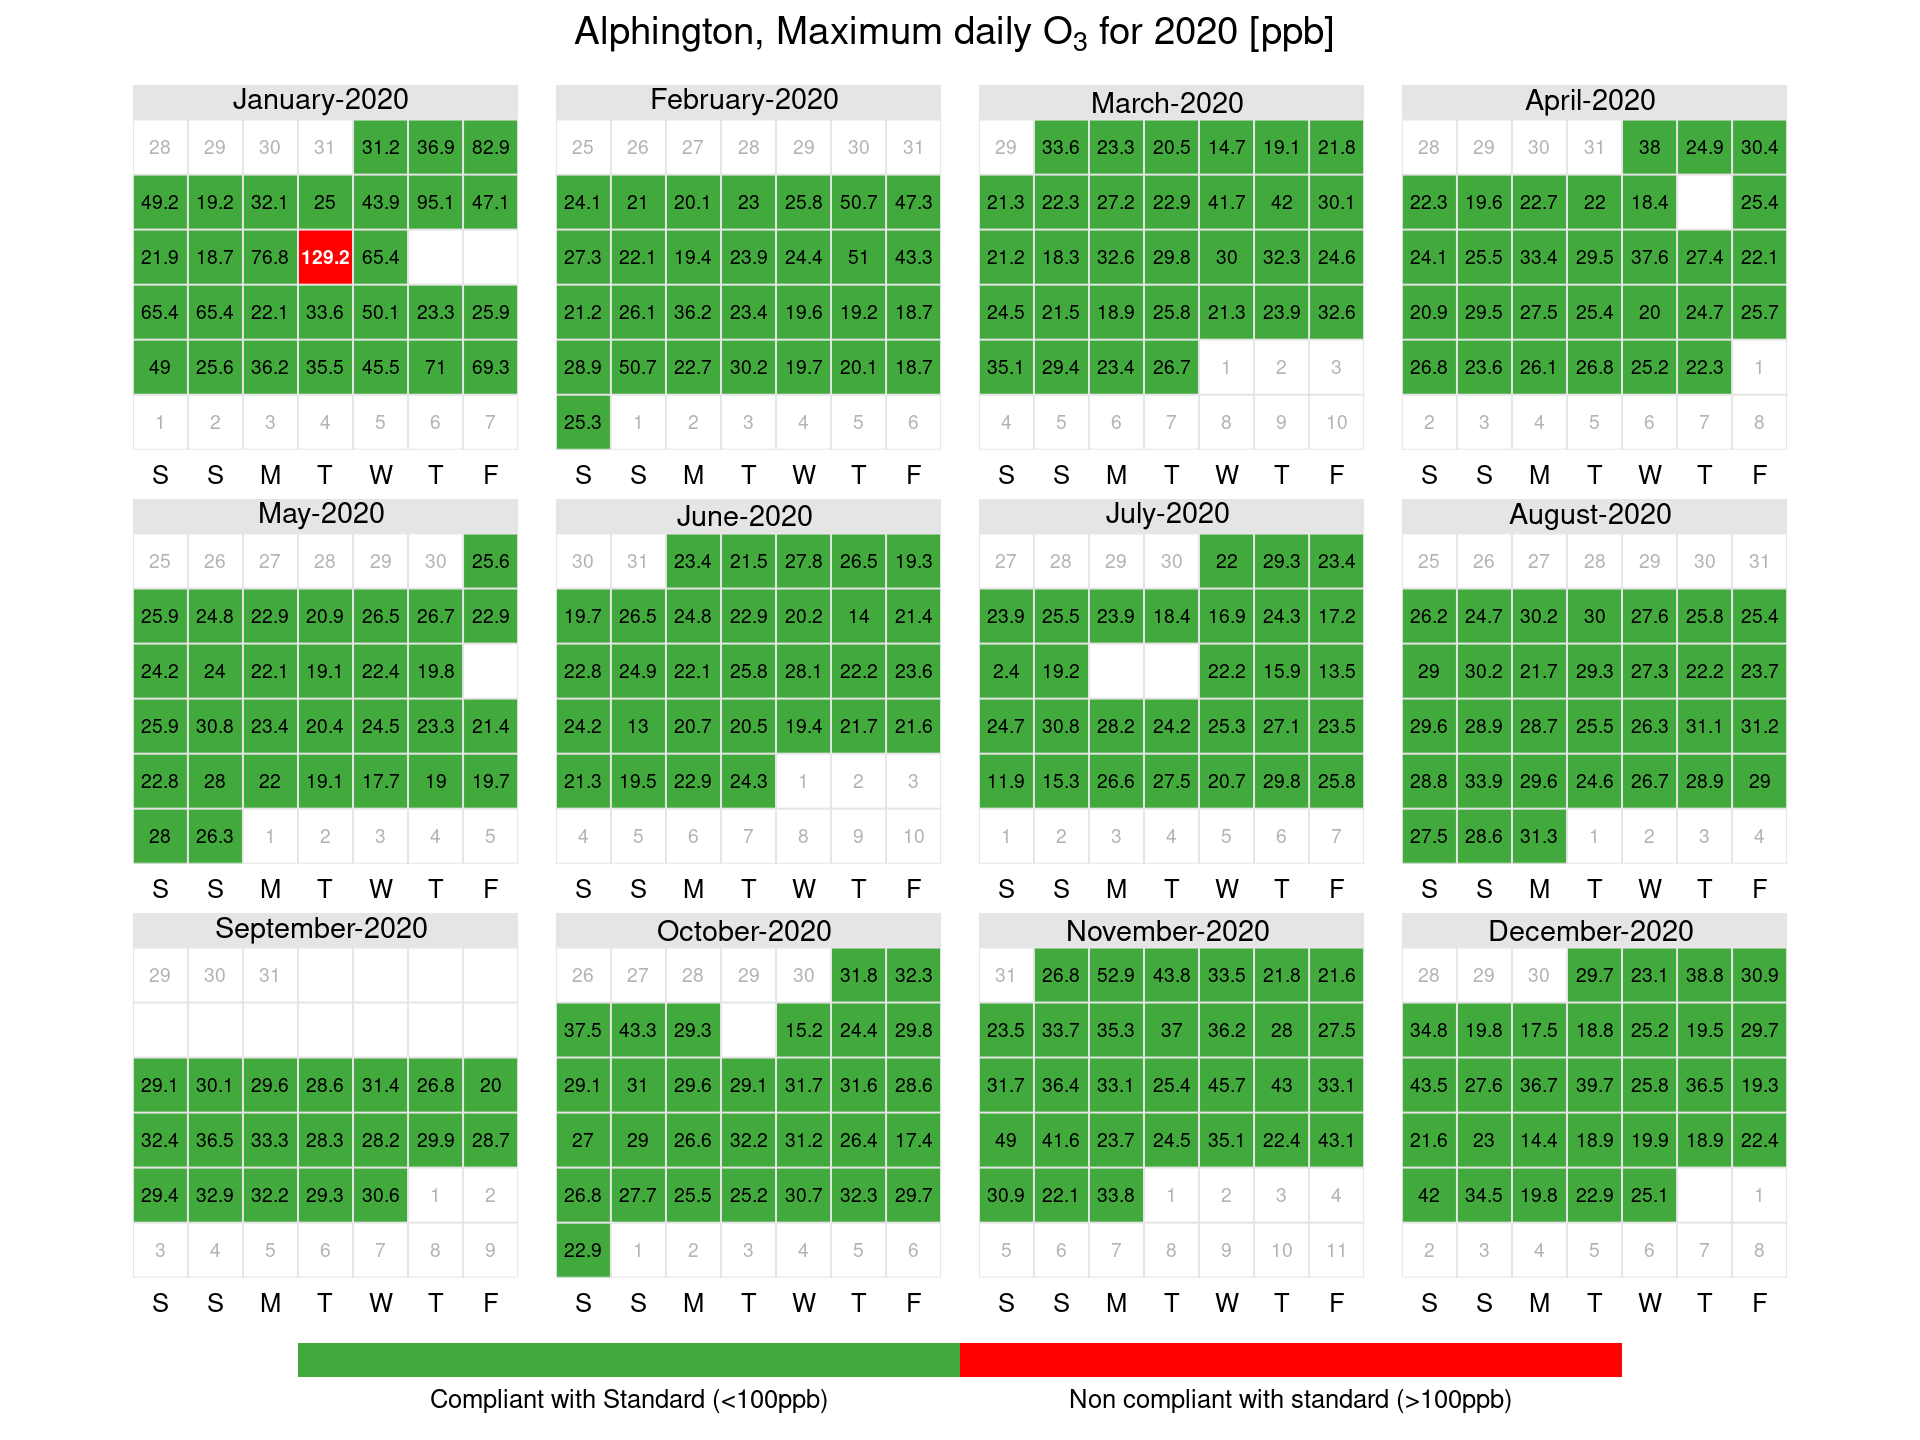
Figure 15: Alphington 4-hour ozone calendar plots showing days where exceedances of the maximum daily standard occurred in ppb
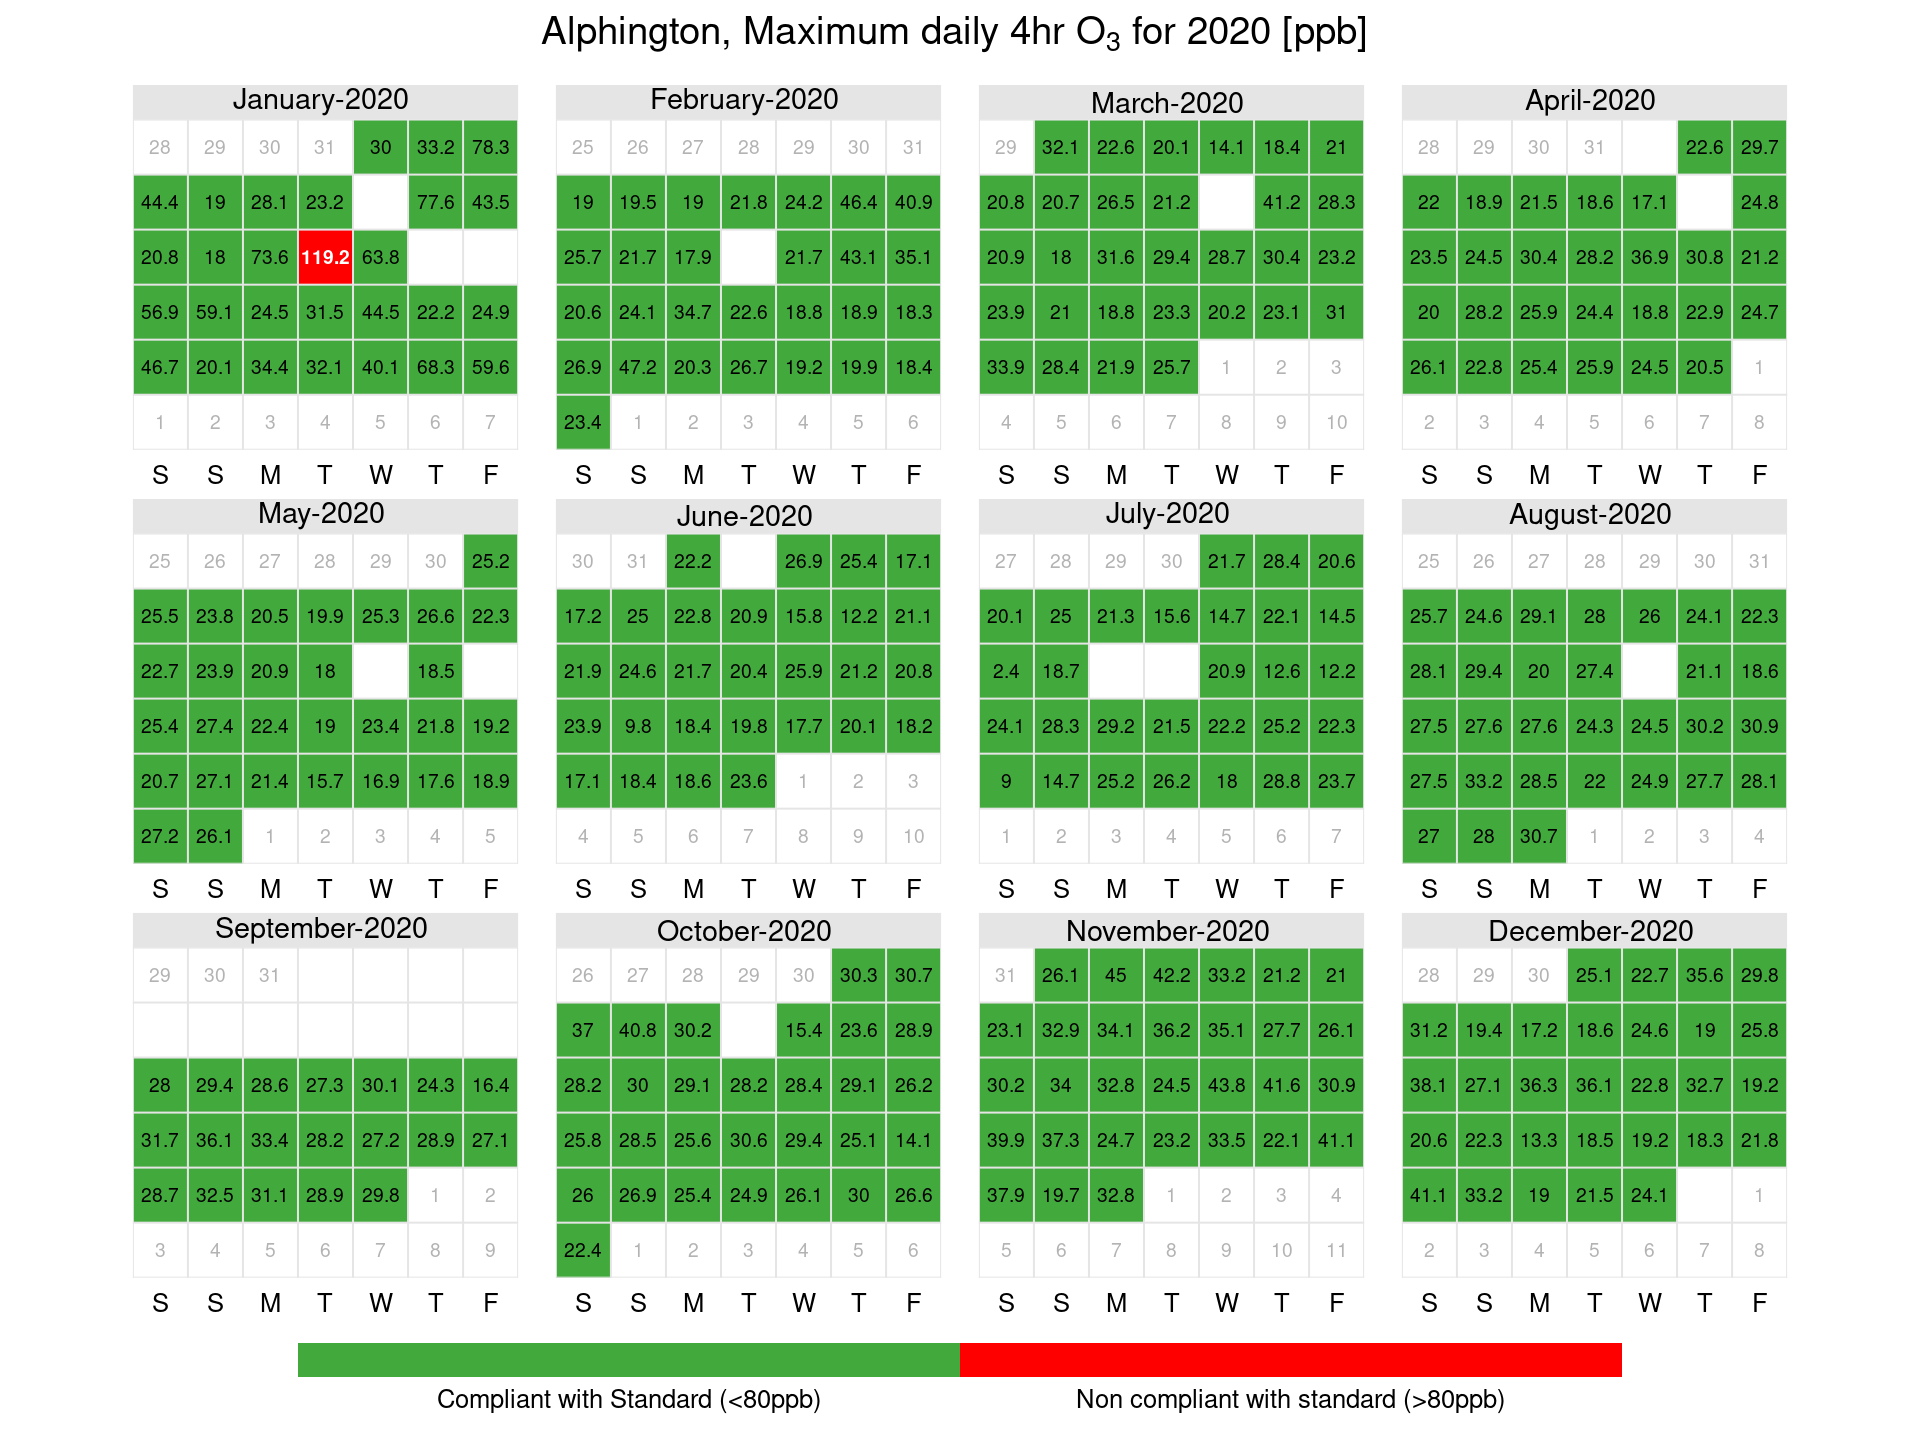
Figure 16: Dandenong ozone calendar plots showing days where exceedances of the maximum daily standard occurred in ppb
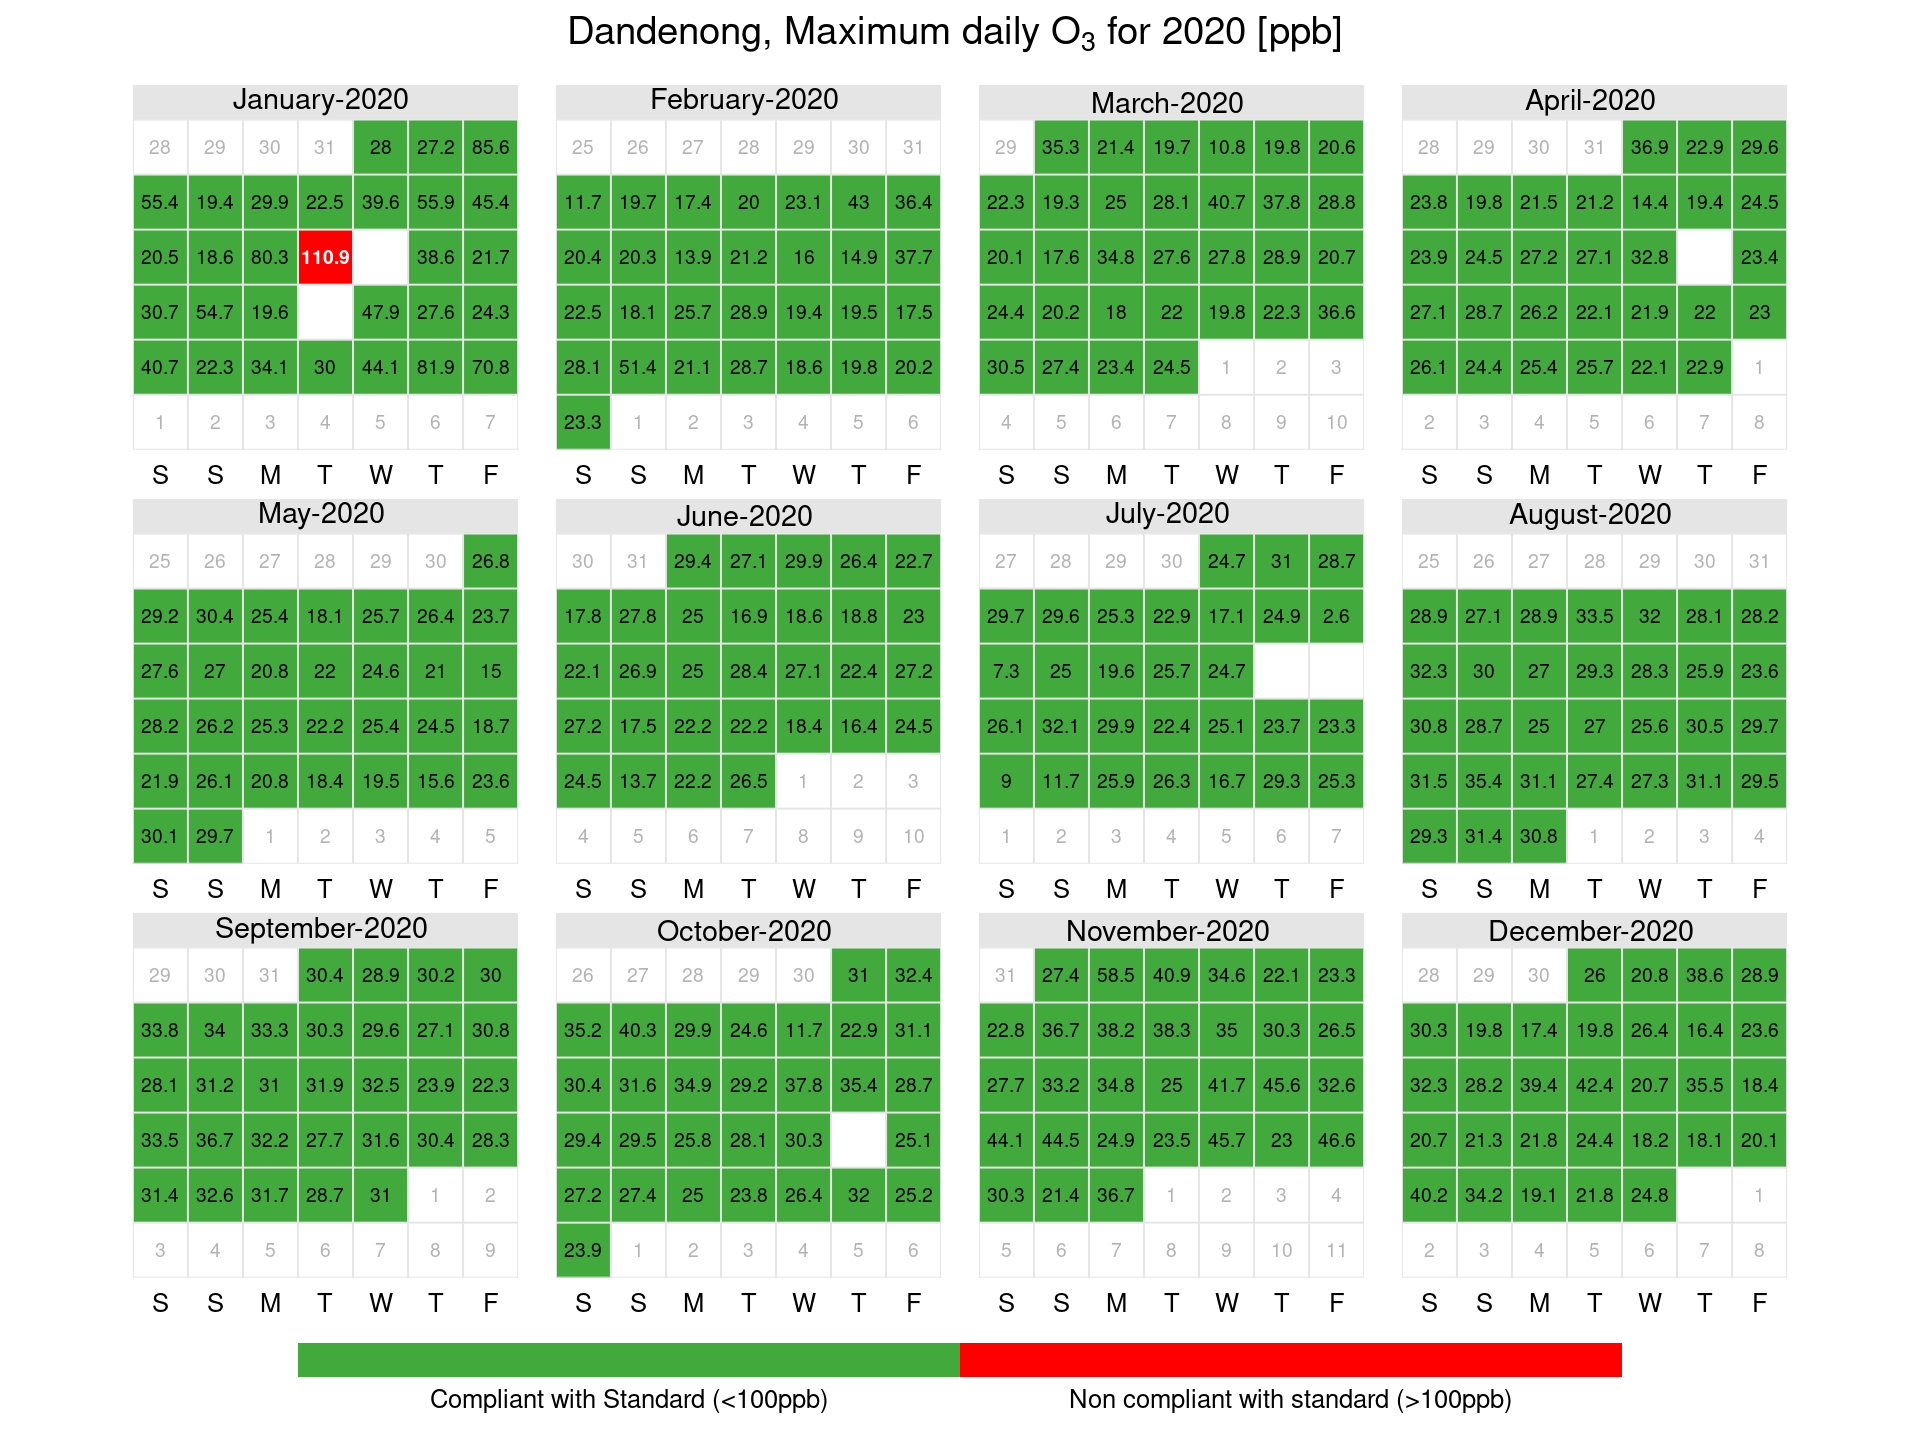
Figure 17: Dandenong 4-hour ozone calendar plots showing days where exceedances of the maximum daily standard occurred in ppb
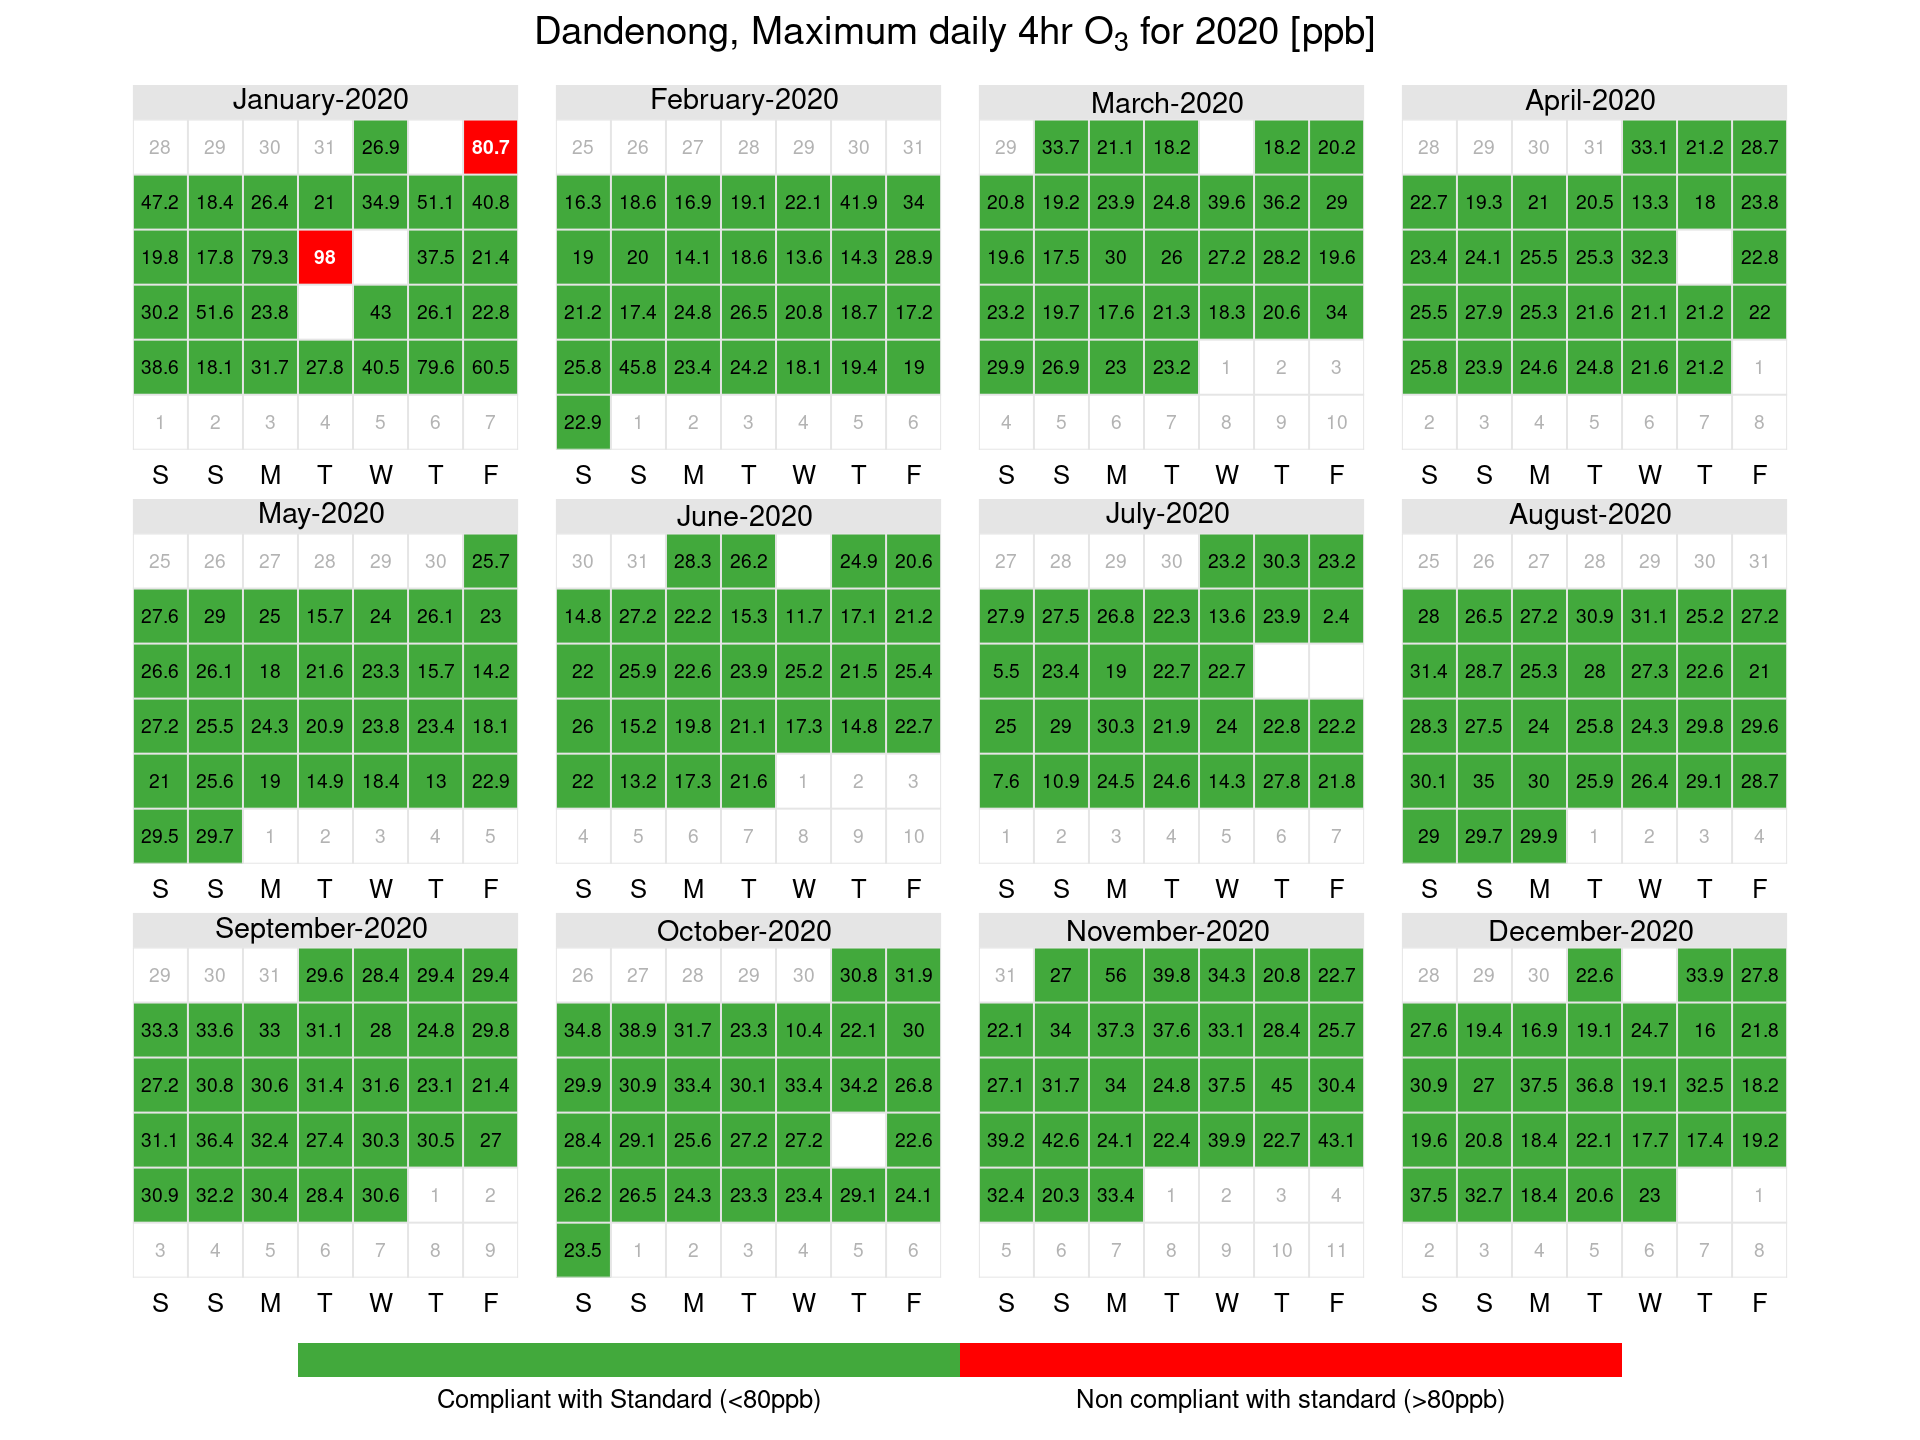
Figure 18: Footscray ozone calendar plots showing days where exceedances of the maximum daily standard occurred in ppb
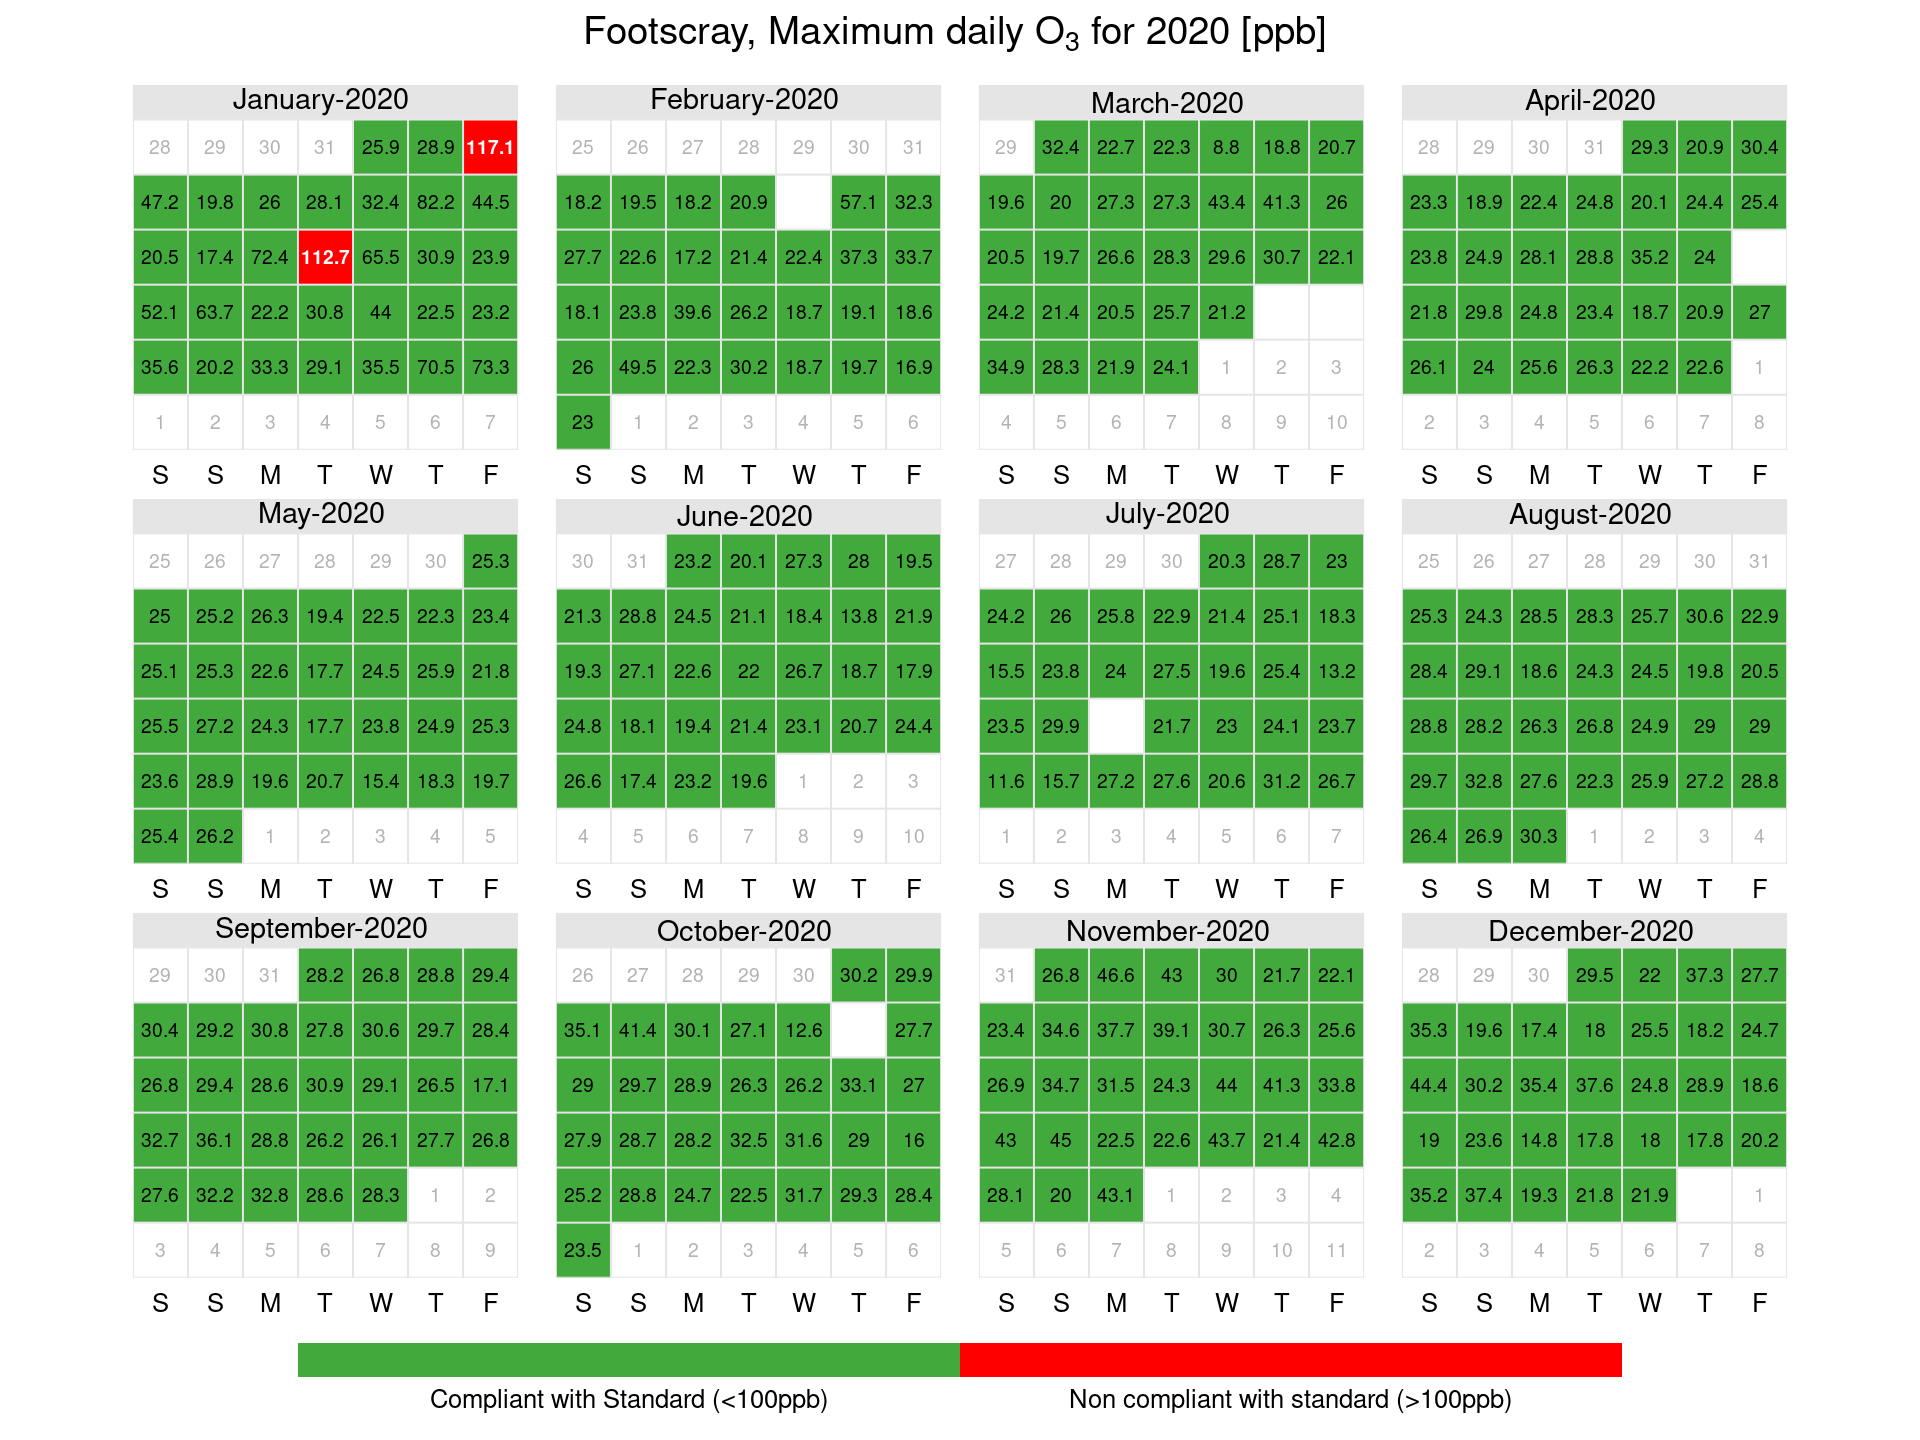
Figure 19: Footscray 4-hour ozone calendar plots showing days where exceedances of the maximum daily standard occurred in ppb
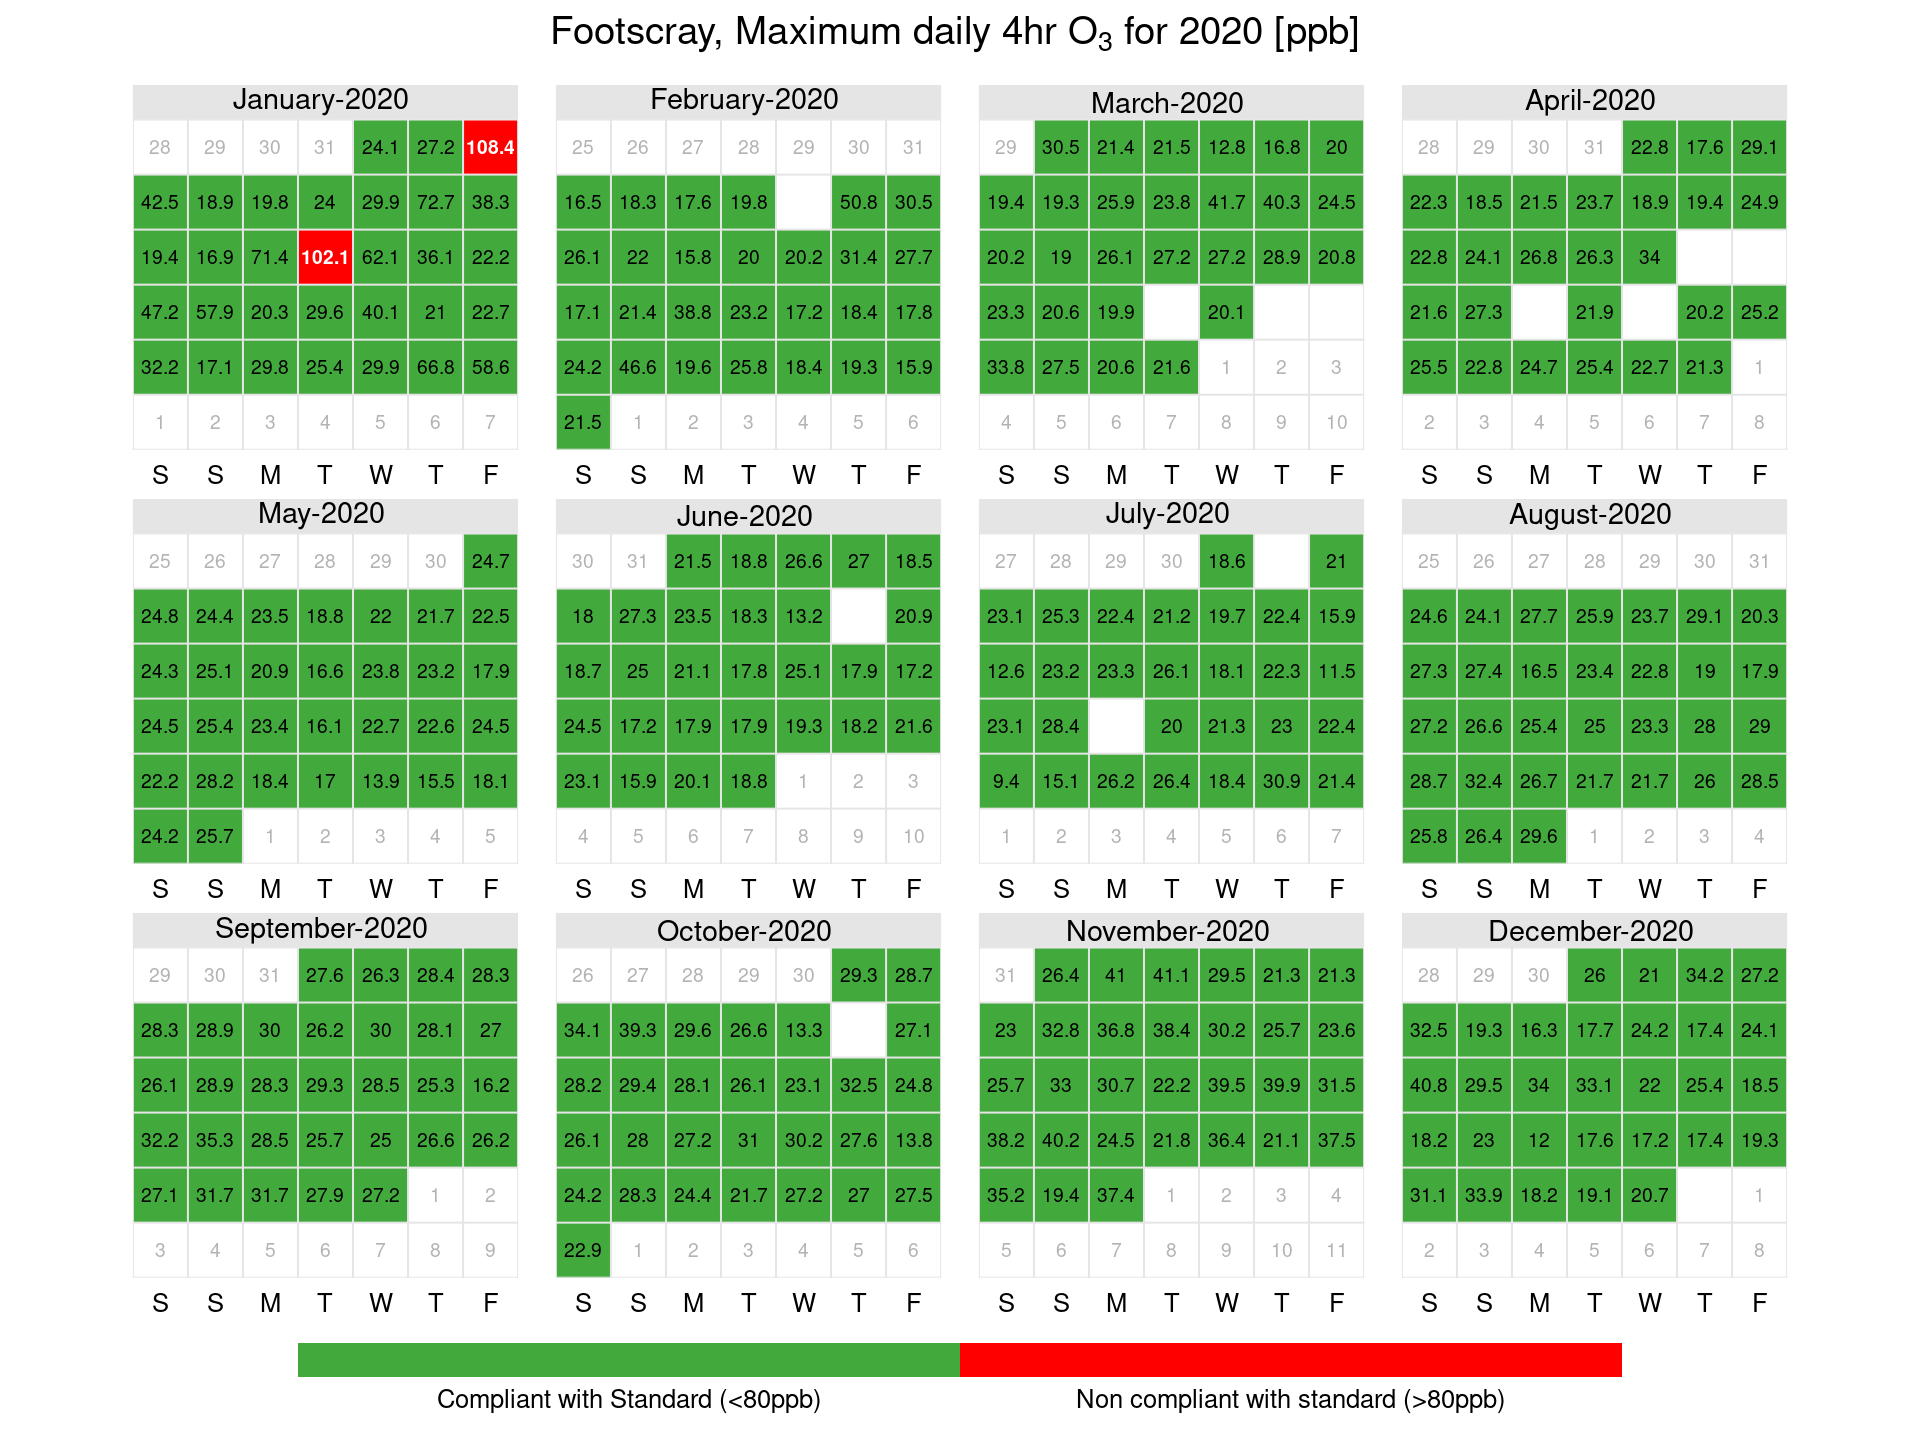
Figure 20: Geelong South ozone calendar plots showing days where exceedances of the maximum daily standard occurred in ppb
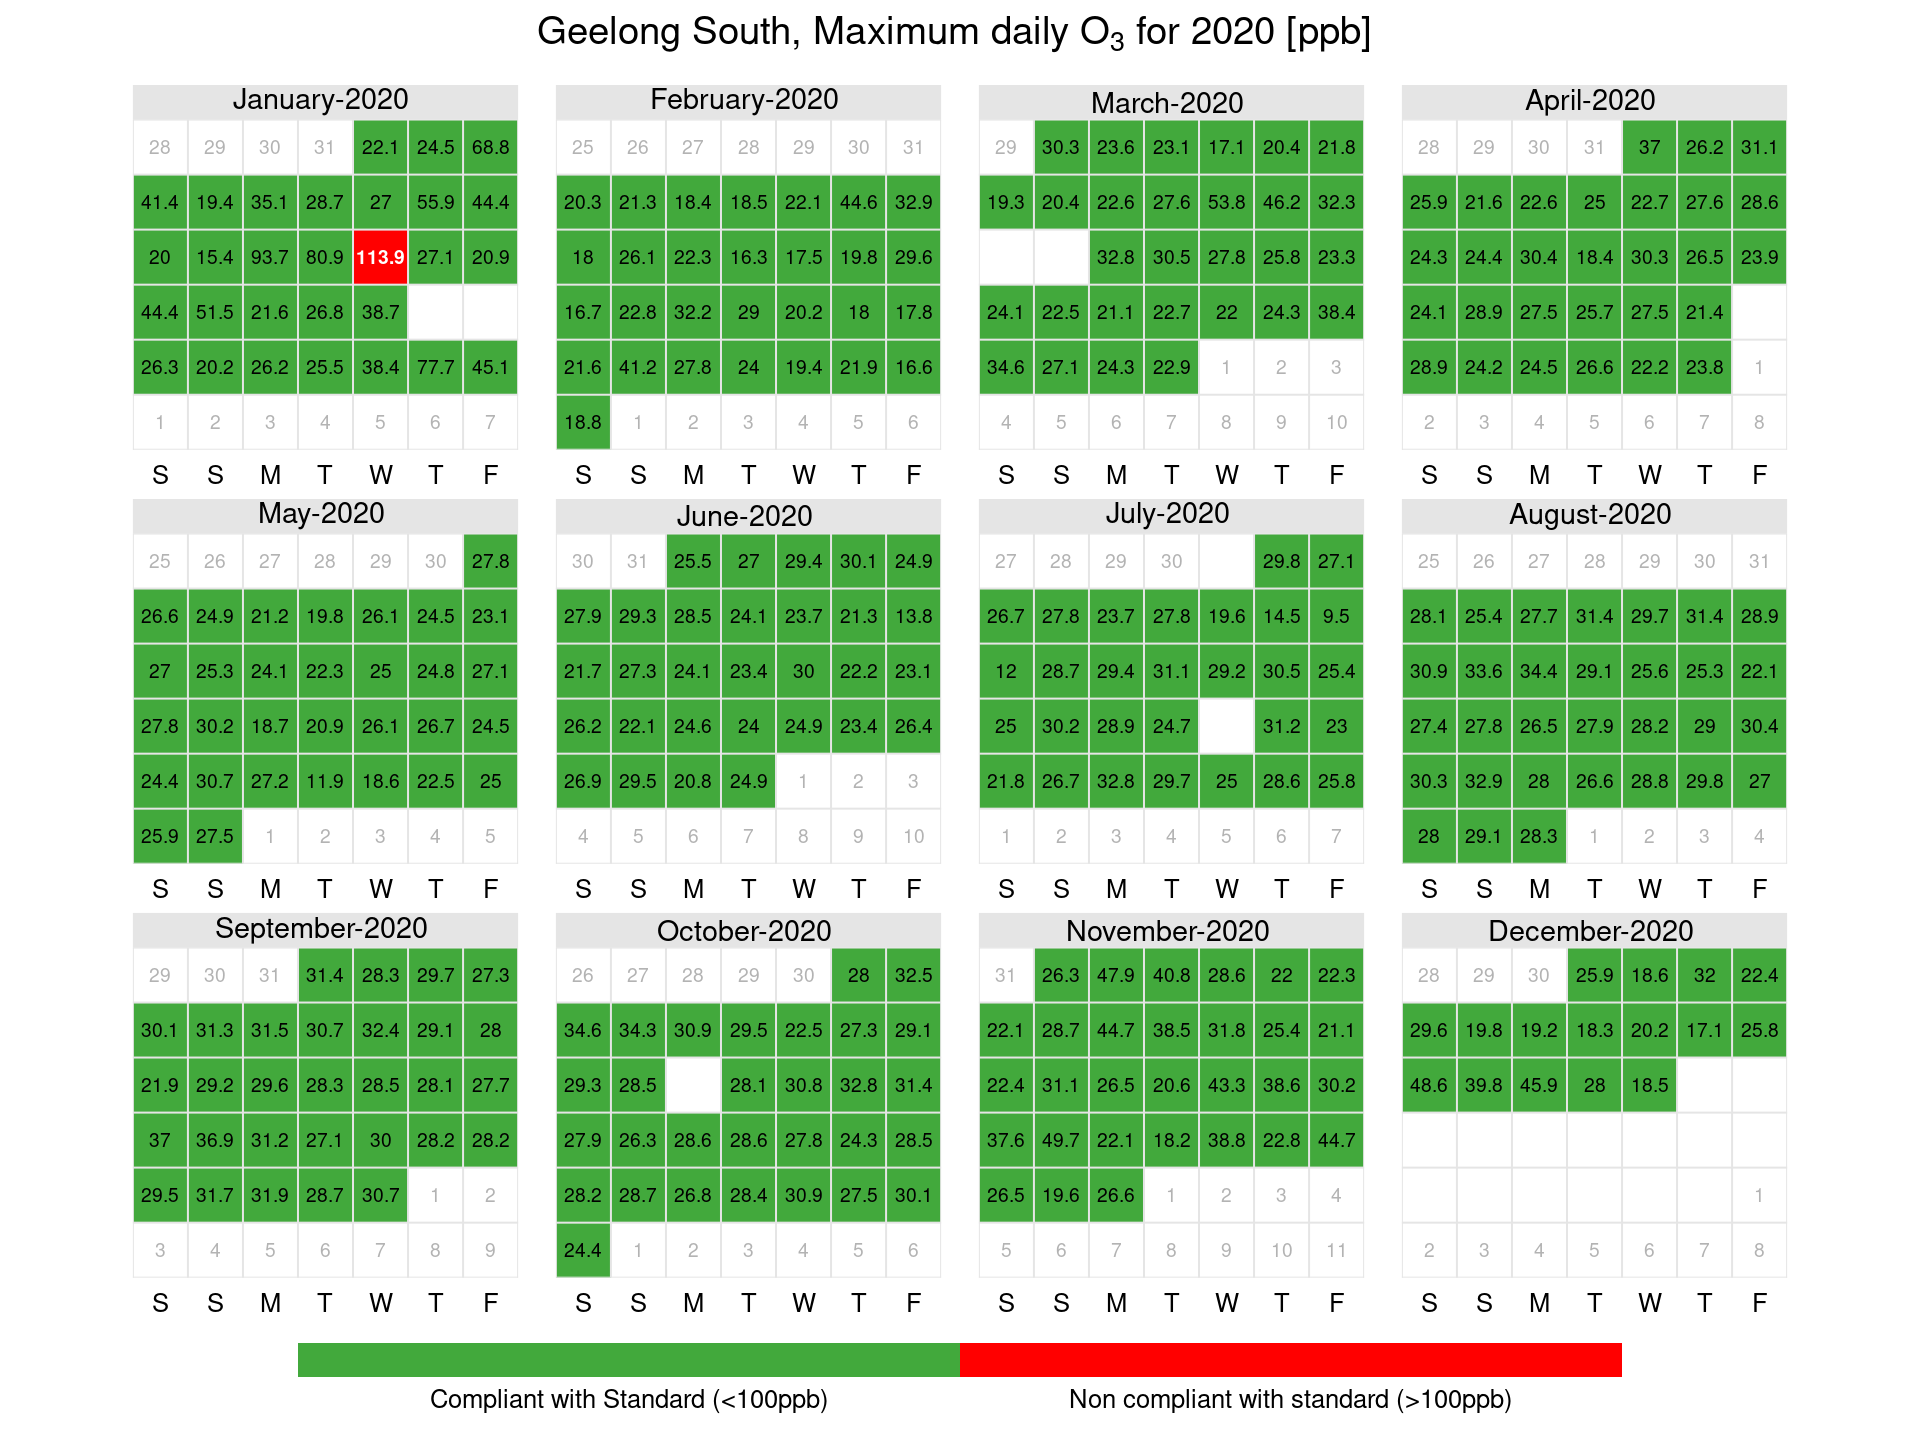
Figure 21: Geelong South 4-hour ozone calendar plots showing days where exceedances of the maximum daily standard occurred in ppb

Figure 22: Melton ozone calendar plots showing days where exceedances of the maximum daily standard occurred in ppb
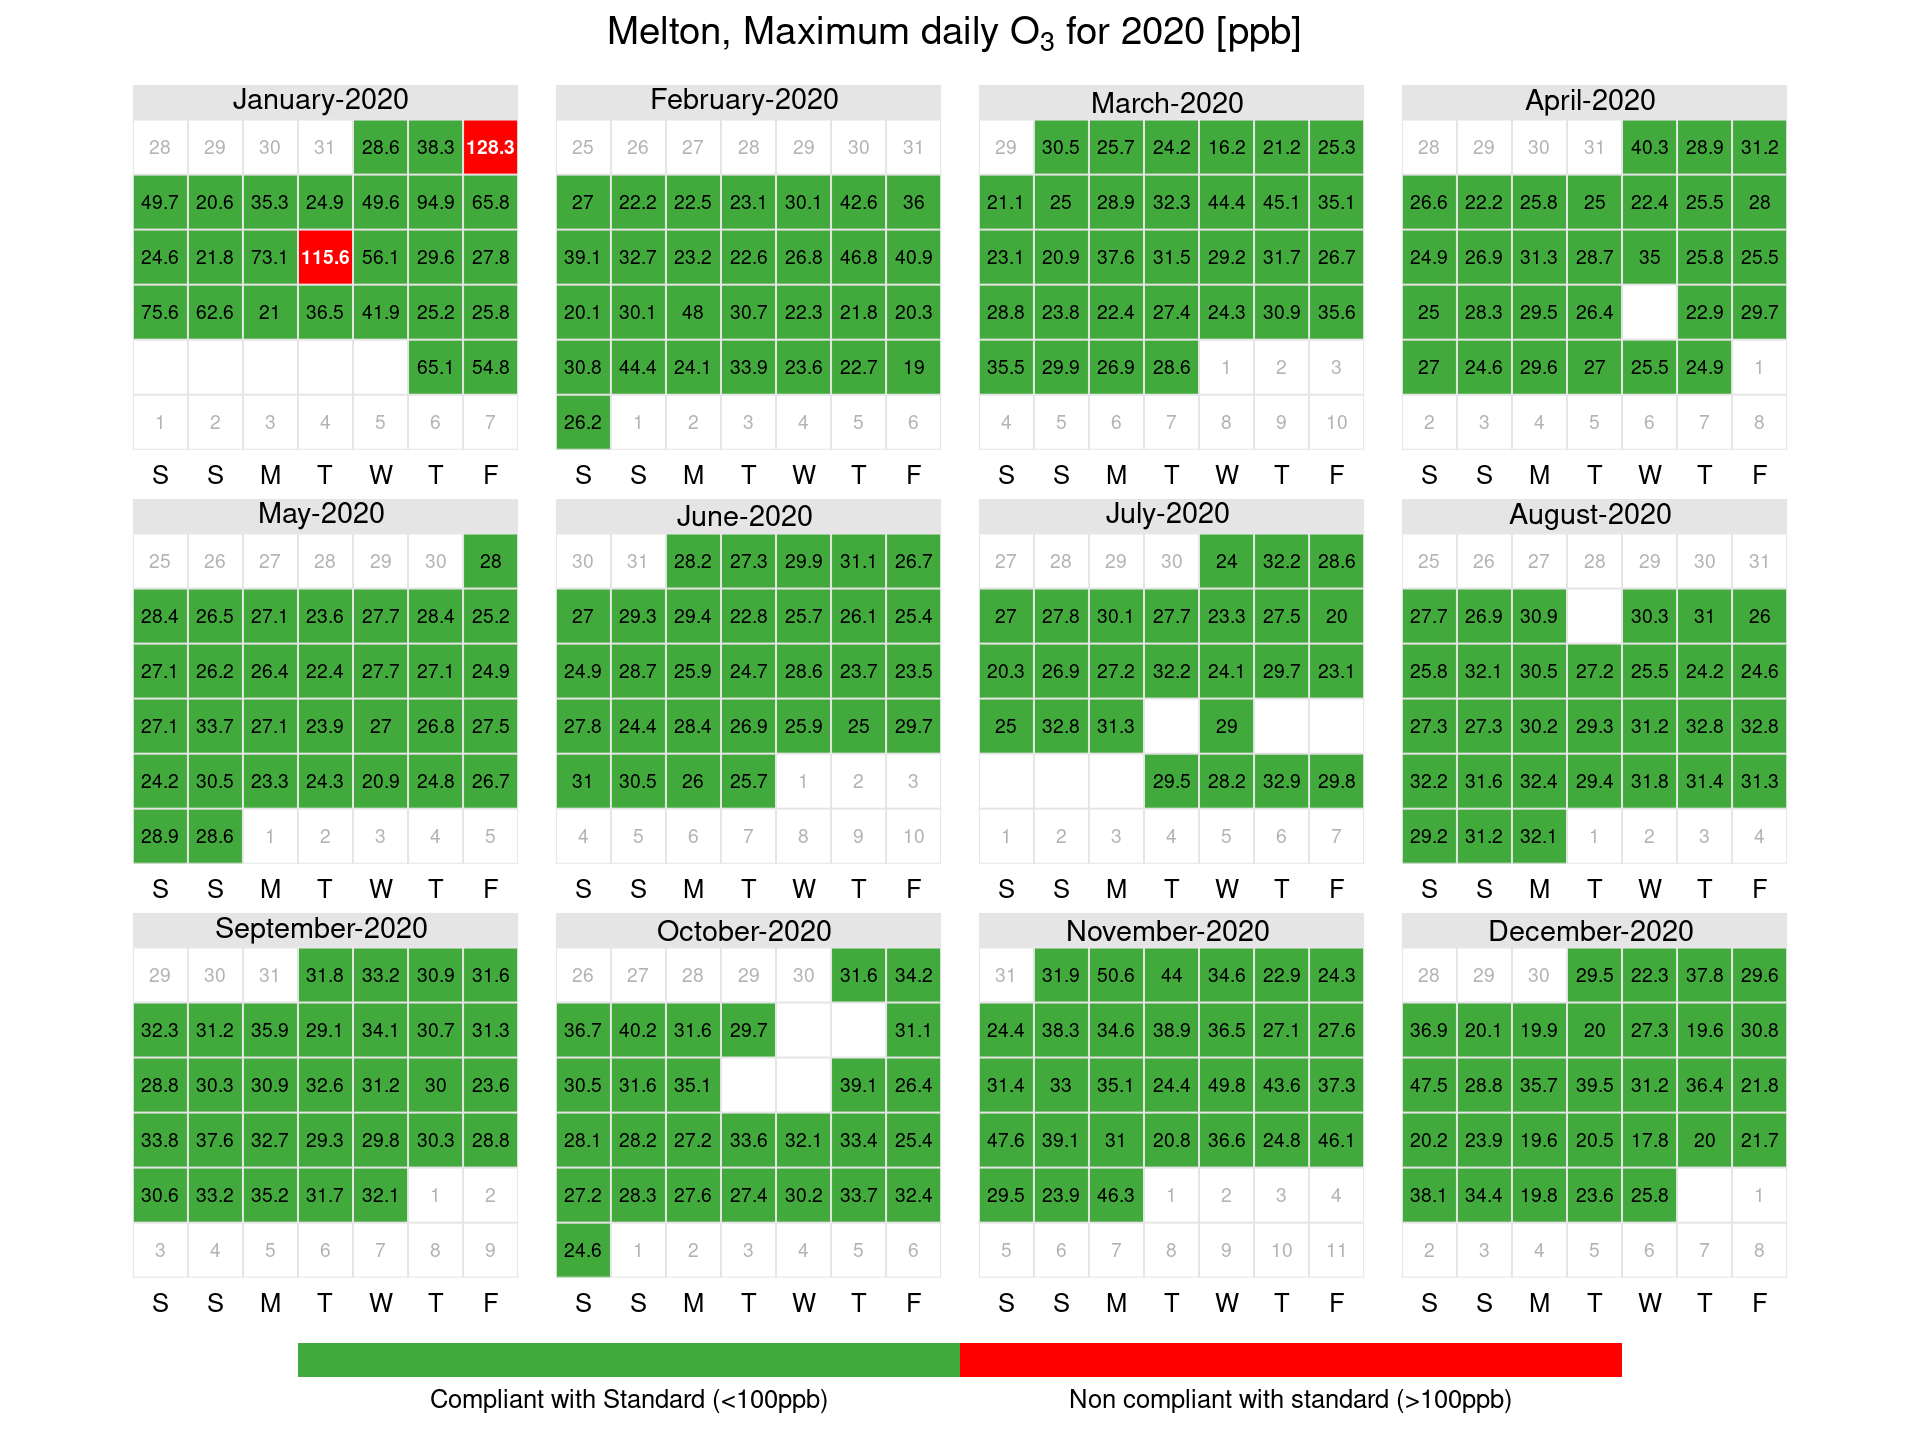
Figure 23: Melton 4-hour ozone calendar plots showing days where exceedances of the maximum daily standard occurred in ppb
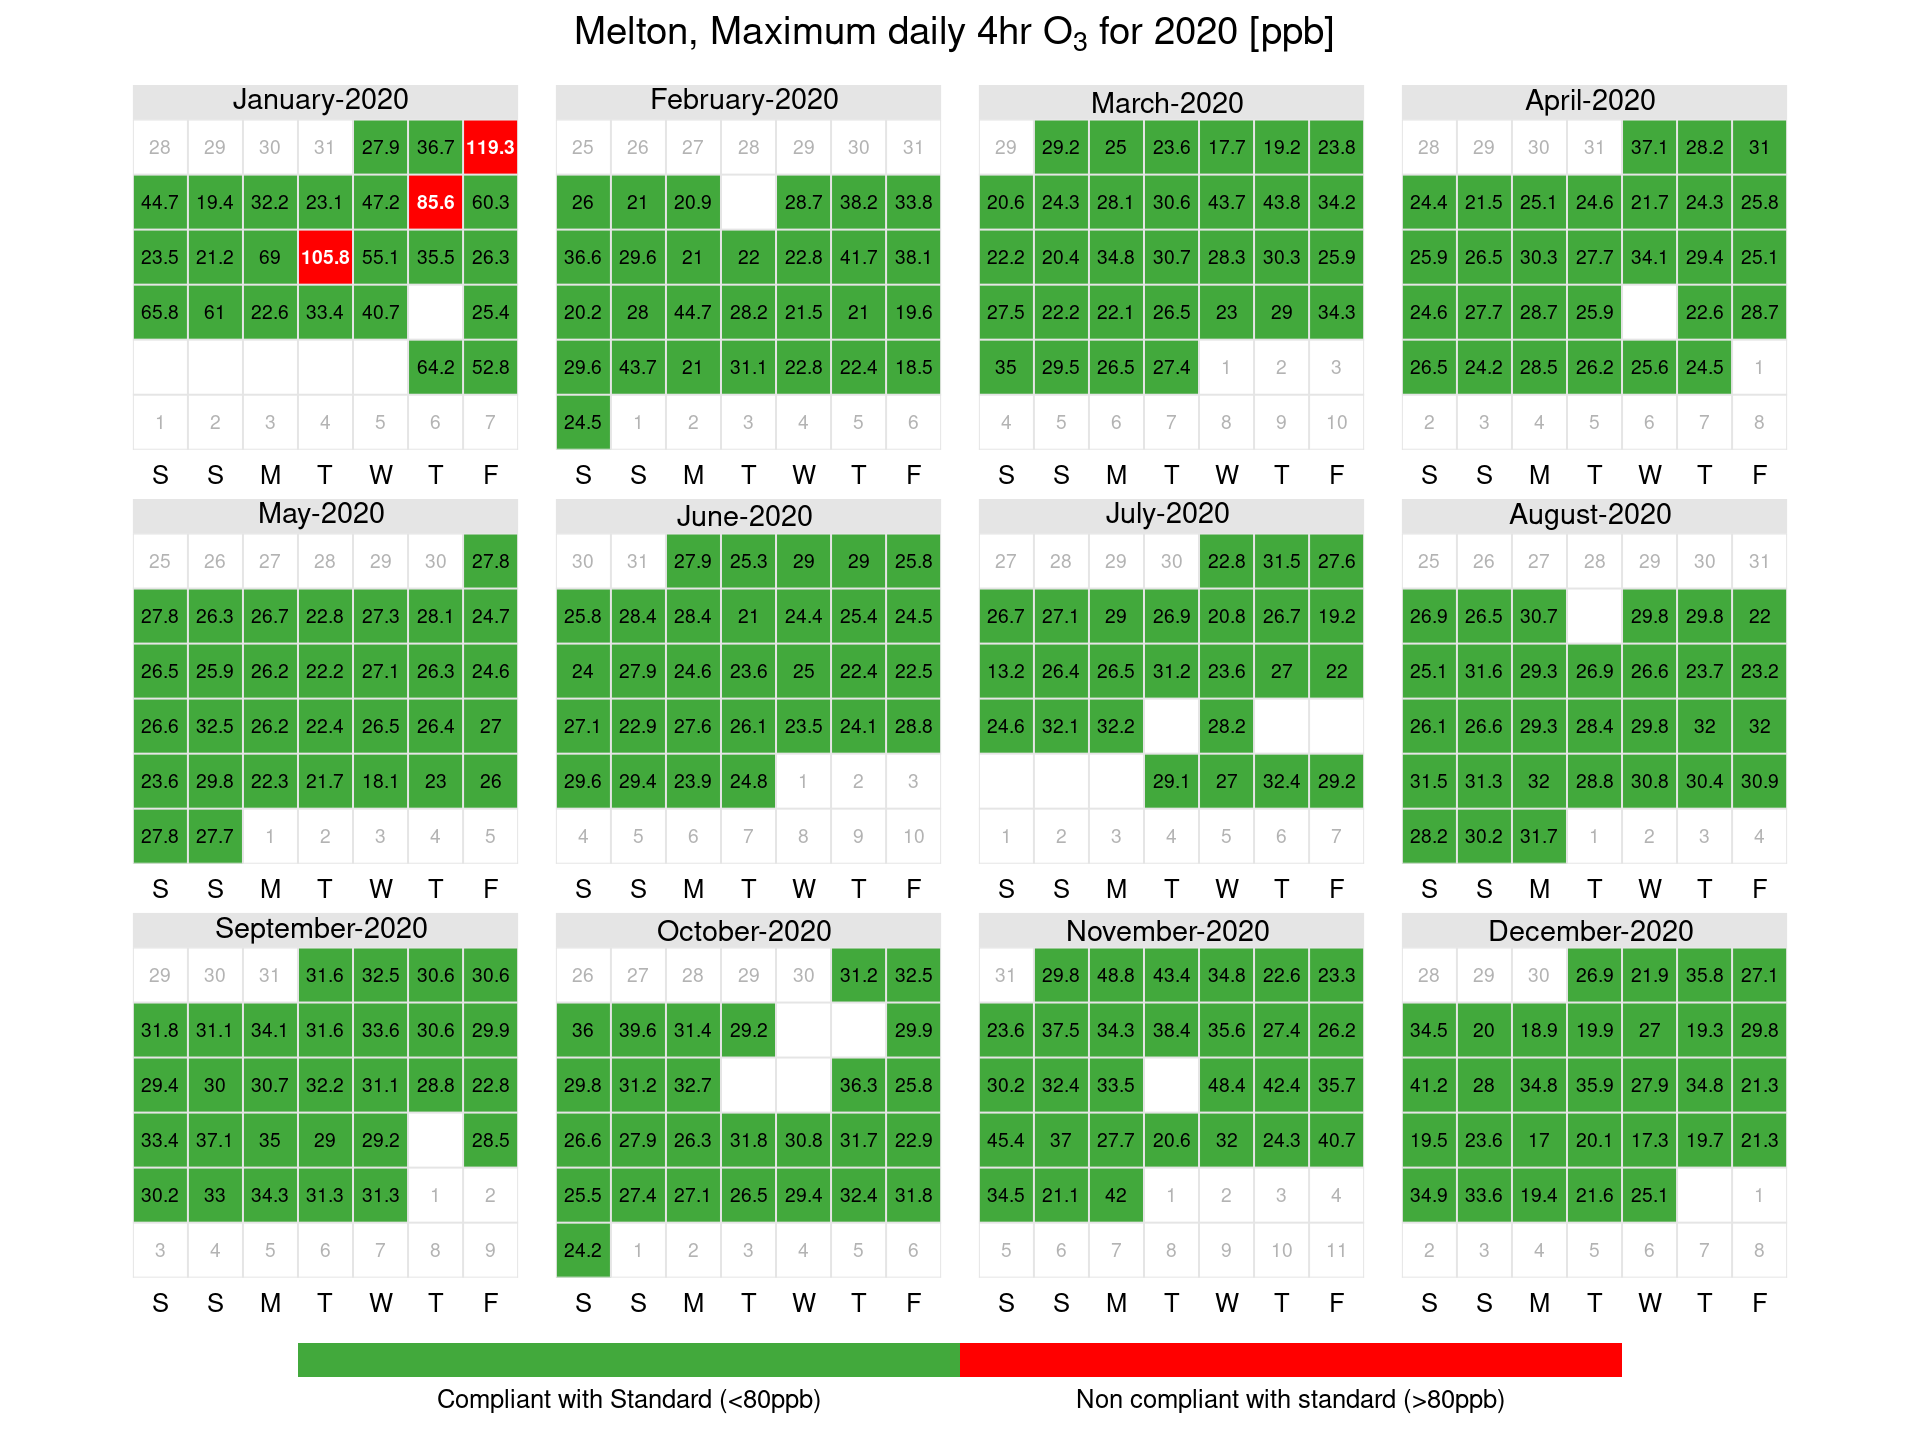
Figure 24: Point Cook ozone calendar plots showing days where exceedances of the maximum daily standard occurred in ppb

Figure 25: Point Cook 4-hour ozone calendar plots showing days where exceedances of the maximum daily standard occurred in ppb
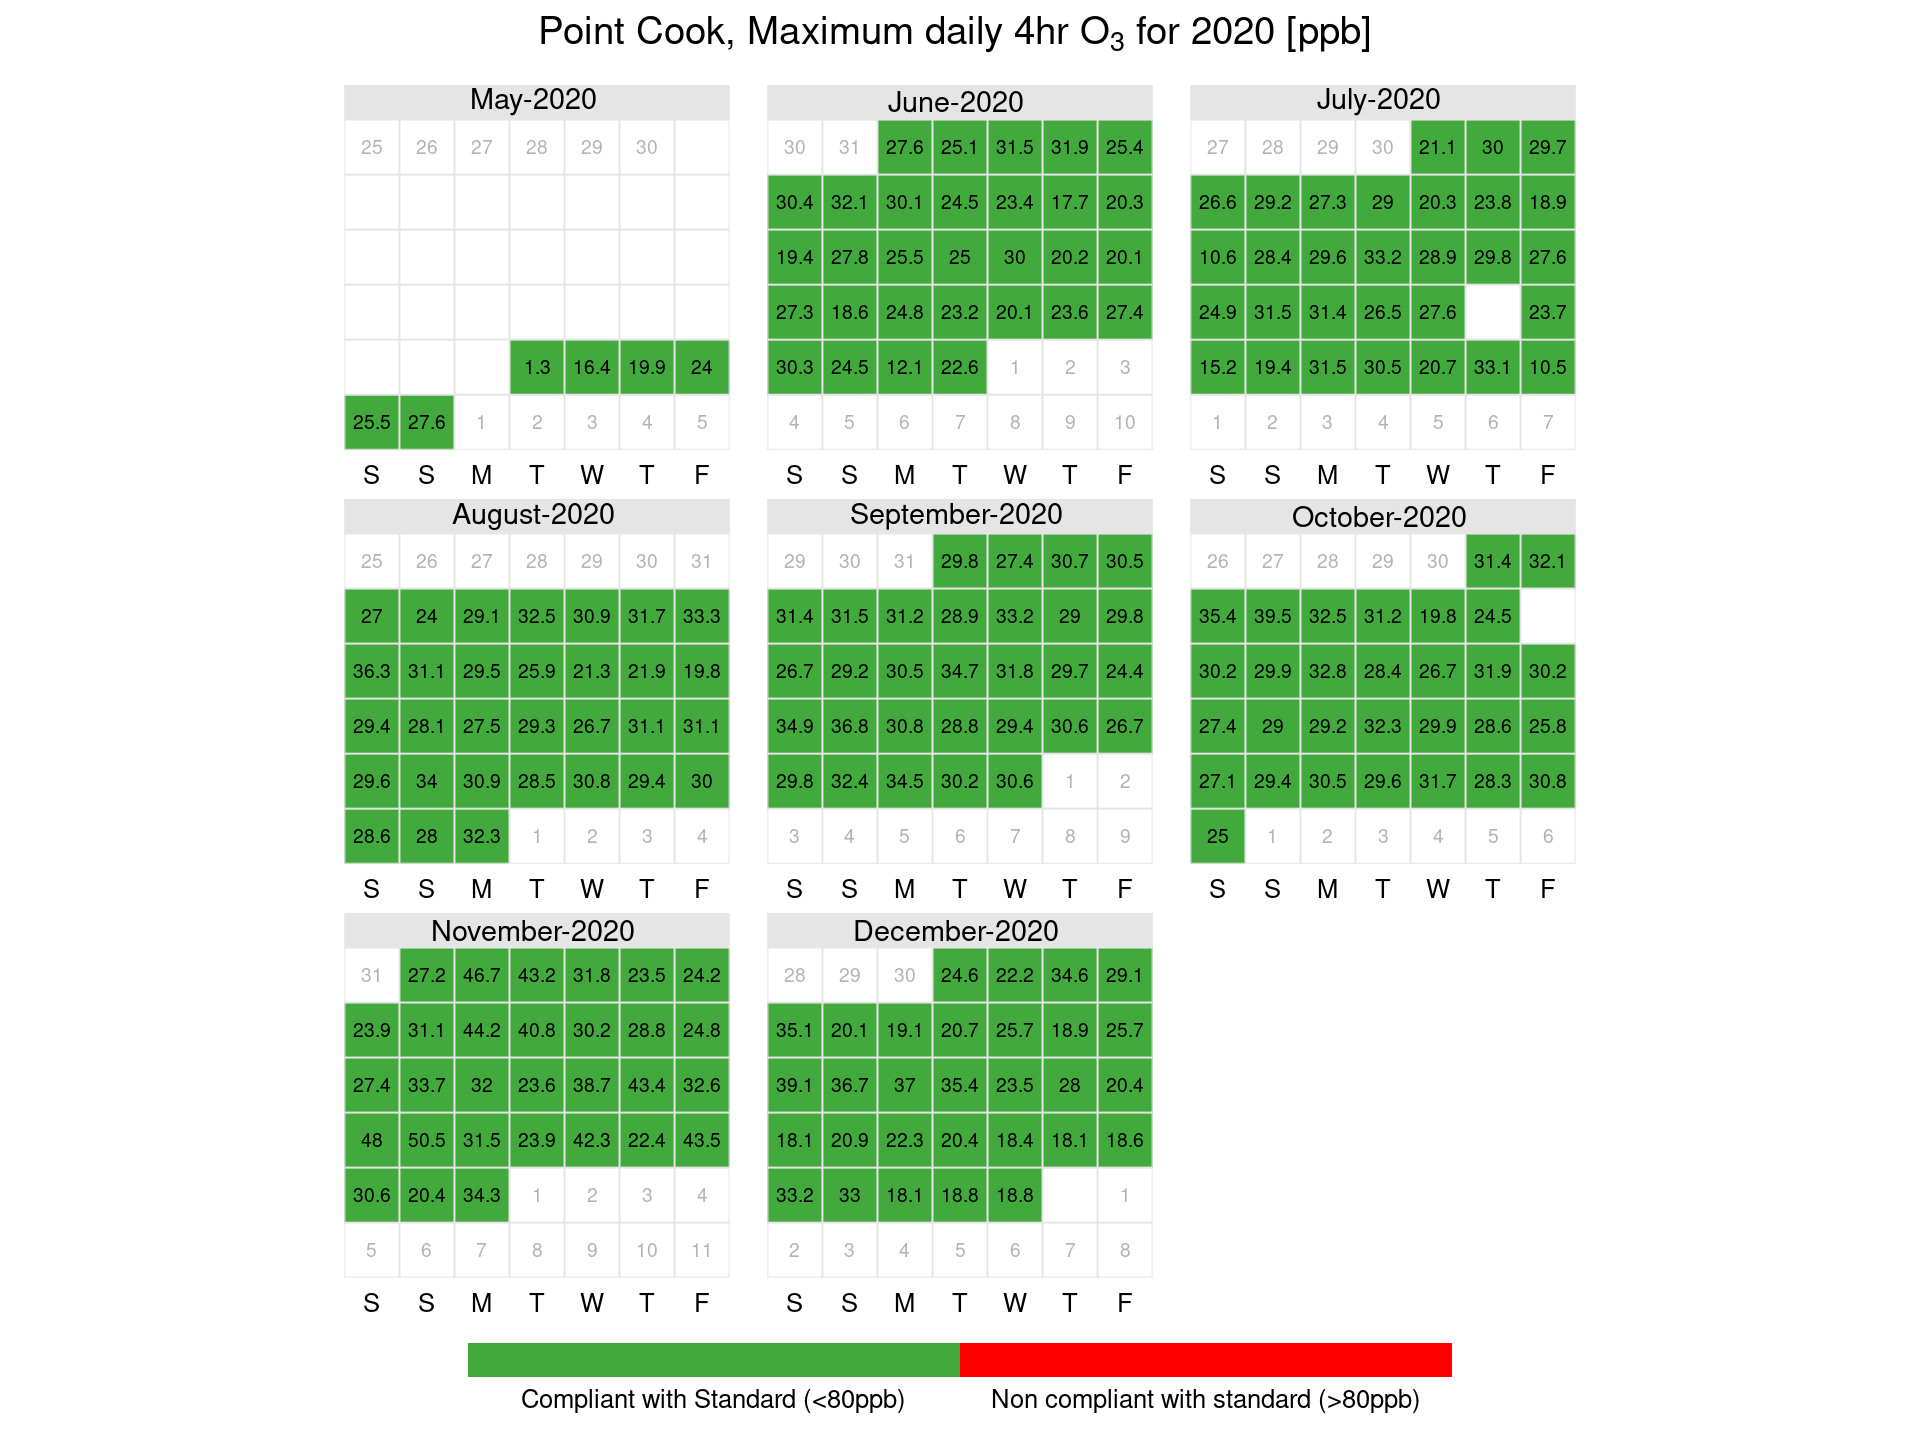
Figure 26: Traralgon ozone calendar plots showing days where exceedances of the maximum daily standard occurred in ppb

Figure 27: Traralgon 4-hour ozone calendar plots showing days where exceedances of the maximum daily standard occurred in ppb
3.6 Sulfur dioxide (SO2)
Percentiles of 2020 daily peak concentrations (over an one-hour and daily averaging periods) are provided for sulfur dioxide for each station and standard in Tables 25 and Table 26. Daily peak values are formed only when at least 75 per cent of the data for the day are valid.
There were no exceedances of the sulfur dioxide standard recorded in 2020.
Table 25: One-hour sulfur dioxide percentiles
| (% days) | Max | 99th | 98th | 95th | 90th | 75th | 50th | |
|---|---|---|---|---|---|---|---|---|
| Alphington | 84.7 | 5.3 | 4.39 | 3.85 | 2.76 | 2.2 | 1.4 | 0.8 |
| Altona North | 23.22 | 43.6 | 41.08 | 32.98 | 26.8 | 19.58 | 8.7 | 3.9 |
| Geelong South | 80.6 | 27.4 | 14.22 | 8.52 | 4.45 | 3.26 | 1.5 | 0.6 |
| Traralgon | 91.26 | 30.8 | 19.21 | 14.64 | 9.47 | 6.84 | 3.6 | 1.75 |
Table 26: Daily sulfur dioxide percentiles
| (% days) | Max | 99th | 98th | 95th | 90th | 75th | 50th | |
|---|---|---|---|---|---|---|---|---|
| Alphington | 84.7 | 2.45 | 2.01 | 1.51 | 1.13 | 0.86 | 0.57 | 0.33 |
| Altona North | 23.22 | 9.61 | 9.4 | 8.02 | 6.48 | 4.56 | 2.43 | 1.25 |
| Geelong South | 80.6 | 2.64 | 1.7 | 1.34 | 1.06 | 0.84 | 0.5 | 0.28 |
| Traralgon | 91.26 | 5.56 | 3.23 | 2.33 | 2.03 | 1.47 | 0.94 | 0.56 |
Reviewed 16 September 2021
