


Executive summary
This report presents the results of air quality monitoring in Victoria for 2020 and assesses them against the requirements of the Ambient Air Quality National Environment Protection Measure (AAQ NEPM) (referred to as the Measure).
Based on the NEPM ambient air monitoring stations, Victoria’s air quality was generally considered to be good in 2020, although there were periods of poor air quality. This was mainly due to major bushfires in January and February which resulted in significant smoke impacts and urban pollution across wide areas of the state. EPA also collects data from stations at sites with specific air pollution issues, such as the Brooklyn Industrial Precinct and in the Latrobe Valley (excluding Traralgon air monitoring station). These stations are additional to those required for reporting against the Measure, and therefore the data from these stations are not included in this report.
Environment Protection Authority Victoria (EPA) provides hourly data updates on air pollution levels and categories on EPA AirWatch. EPA’s historical air pollution data can be accessed on DataVic.
What is the Measure?
The Measure establishes national ambient air quality standards. It aims to guide policies around the protection of human health by providing a consistent framework for monitoring and reporting common air pollutants: nitrogen dioxide (NO2), carbon monoxide (CO), ozone (O3), sulfur dioxide (SO2), lead (Pb), and particles (PM10 and PM2.5). EPA is responsible for monitoring and reporting Victoria’s ambient air quality in accordance with the requirements of the Measure.
Compliance with the Measure
EPA assesses air quality in Victoria against the standards and pollutant goals defined in the Measure. Compliance with the Measure requires that air quality standards are not exceeded more than the allowable number, as outlined in Schedule 2 of the Measure. Compliance with the Measure also requires that a minimum of 75 per cent of data are available for each quarter in the year. In addition to standard instrumentation for measuring compliance with the Measure, EPA also collects data from stations at sites with specific air pollution issues, such as the Brooklyn Industrial Precinct and in the Latrobe Valley (excluding Traralgon air monitoring station). This is known as ‘campaign monitoring’. These data are not assessed against the Measure and therefore not included in this report. Results for these air monitoring stations are reported on EPA AirWatch and historical air pollution data can be accessed on DataVic .
Air monitoring summary 2020
Victoria’s air monitoring plan for the assessment of air quality against the Measure was first approved in February 2001 by national, state and territory ministers on the National Environment Protection Council. Data presented in this report have been produced in accordance with the monitoring plan, with exceptions noted where required.
1.1 Monitoring stations
The Measure requires EPA to monitor the pollutants: carbon monoxide (CO), nitrogen dioxide (NO2), ozone (O3), sulfur dioxide (SO2), particles less than 10 micrometres (μm) in diameter (PM10), and particles less than 2.5 μm in diameter (PM2.5). EPA no longer monitors for lead, as ambient concentrations in Victoria have decreased significantly, due to the phase out of leaded petrol.
Eight regions are defined in Victoria’s air monitoring plan. These are:
- Port Phillip and Latrobe Valley regions, which have Measure-compliant monitoring stations
- Ballarat, Bendigo, Shepparton, Warrnambool and Mildura, where campaign monitoring was previously conducted
- Wodonga, where data from monitoring at Albury, New South Wales was used.
EPA’s 2020 Measure-compliant monitoring stations are shown in Figure 1 and Figure 2. The monitoring stations, pollutants monitored, and site types are summarised in Table 1. Site types are defined in the Measure as ‘generally representative upper bound for community exposure’ and ‘population-average sites’. EPA also has trend stations which provide data on the long-term trends in air pollution over many years. The types of communities covered by each monitoring station (known as the ‘exposed population’) is described in the ‘location category’ column in Table 1.
Figure 1: Defined regions and population density in Victoria
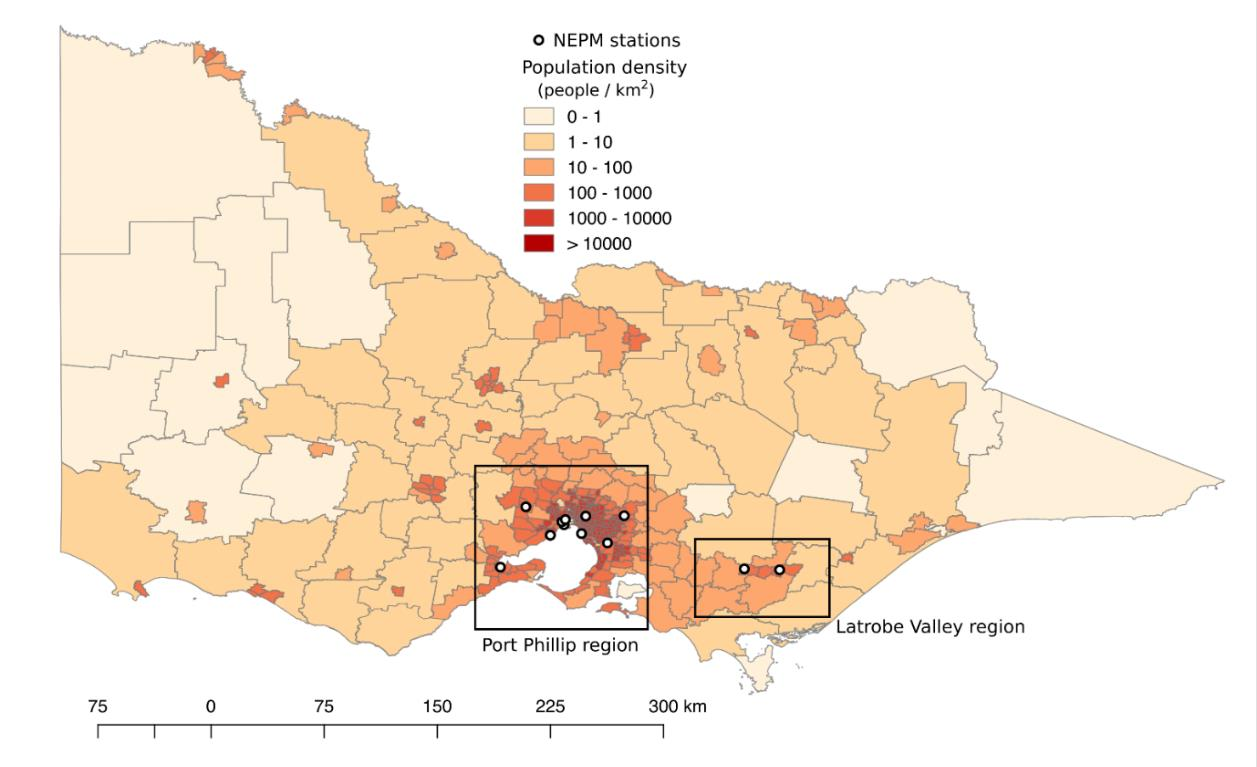
Figure 2: Defined regions and population density in Port Phillip region
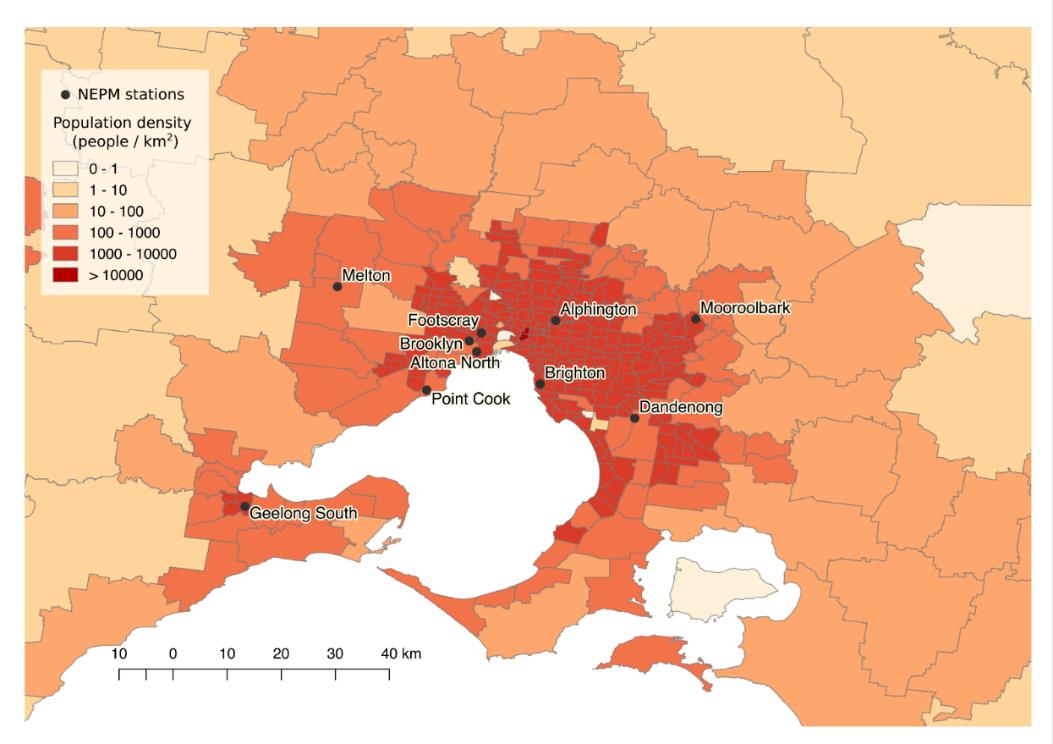
Table 1: EPA NEPM monitoring stations and parameters
| Monitoring station | Region | Location category | CO | NO2 | O3 | SO2 | PM10 | PM2.5 |
|---|---|---|---|---|---|---|---|---|
| Alphington | Melbourne East | Residential | G* | G* | Pop | Pop | G* | G* |
| Altona North | Melbourne West | Industrial/ residential | G* | |||||
| Dandenong | Melbourne East | Industrial | Pop* | Pop | ||||
| Footscray | Melbourne West | Residential | G* | G* | G* | G* | ||
| Geelong South | Geelong | Industrial/ residential | G* | G* | Pop* | G* | G* | G* |
| Melbourne CBD | Melbourne CBD | Commercial/ residential | G | |||||
| Melton | Melbourne West | Residential | G | |||||
| Mooroolbark | Melbourne East | Residential | Pop | Pop | ||||
| Point Cook | Melbourne West | Residential | Pop* | G* | ||||
| Traralgon | Latrobe Valley | Residential | G* | G* | G* | G* | G* | |
| Note: | ||||||||
| * Trend station (use to determine long term trends in air quality | ||||||||
| 1 G Generally representative upper bound | ||||||||
| a Pop Population average |
1.1.1 Implementation of the monitoring plan
EPA continually evaluates Victoria’s air quality monitoring program to determine which sites and pollutants need to be monitored. Stations are located and set up according to the Australian Standards (Table 2). Generally, EPA’s air monitoring stations have remained stable over the years, although changes to the network are made as needed. Recent changes include:
- A PM2.5 monitoring station was established in the Melbourne CBD in 2017.
- A PM2.5 monitoring station was established in Bendigo in 2020. Data from this station are not included in this report as it is a campaign station. Data from this station are available on EPA AirWatch.
- A PM2.5 monitoring station was established in Campbellfield in 2020. Data from this station are not included in this report as it is a campaign station. Data from this station are available on EPA AirWatch.
- In mid-2019, the Altona monitoring station was temporarily shut down pending relocation to another site, a new site was established at a nearby location in late 2020.
1.1.2 Screening procedure
Victoria’s air monitoring plan outlines how EPA may use screening procedures to demonstrate whether concentrations of pollutants are consistently below the standards in the Measure. If these screening procedures are satisfied, monitoring may not be required, or may be conducted at fewer locations. Screening procedures conducted in accordance with the Measure have been satisfied a number of for Victorian regions. EPA did not monitor air quality at Ballarat, Shepparton, Warrnambool, Wodonga and Mildura in 2020 as previous monitoring campaigns in these areas showed that pollutant levels were expected to be consistently below the relevant standards.
1.2 Monitoring and reporting methods
Victorian monitoring is conducted in accordance with the Australian Standards as shown in Table 2 and Table 3. Data not meeting the requirements of these Standards and EPA’s quality assurance procedures were identified as invalid and not included in this report. Tapered Element Oscillating Microbalance (TEOM) PM10 data included in this report have been adjusted according to the approved procedure outlined in Technical Paper No. 10 – Collection and Reporting of TEOM PM10 Data 5, using the temperature dependent formula with a constant value of K equal to 0.04. The resulting adjustments vary from no change at daily average temperatures at or above 15°C, to an increase of 40% at a temperature of 5°C. Particle concentration units of μg/m3 refer to volumes at 0°C and one atmosphere of pressure.
1.2.1 NATA status
As of February 2016, EPA outsourced monitoring for PM10 and PM2.5 using the Hivol and Partisol gravimetric methods to Golder Associates (NATA accreditation Number 1910). All other methods currently used by EPA for performance monitoring are covered by its National Association of Testing Authorities (NATA) accreditation (Number 15119) except for PM2.5 using Beta Attenuation Monitors (BAMs). EPA was reaccredited by NATA in 2020. EPA is working to incorporate monitoring for PM2.5 using BAMs as part of its NATA accreditation. The method is in use and all technical elements have been completed, and is due to be assessed at an upcoming NATA audit. Table 2 shows compliance with AS/NZS 3580.1.1:2016 for the siting and operation of each air monitoring station.
Table 2: EPA NEPM monitoring stations siting compliance with AS/NZS 3580.1.1–2016
| Monitoring station | Height above ground | Minimum distance to support structure | Clear sky angle of 120o | Unrestricted airflow of >270o | 20 m from trees | No nearby emission source | Minimum distance from road or traffic |
|---|---|---|---|---|---|---|---|
| Alphington | Y | Y | Y | Y | N | Y | N |
| Altona North | Y | Y | Y | Y | Y | Y | N |
| Dandenong | Y | Y | Y | Y | N | Y | N |
| Footscray | Y | Y | Y | Y | N | Y | N |
| Geelong South | Y | Y | Y | Y | N | Y | N |
| Melbourne CBD | Y | Y | Y | Y | N | Y | N |
| Melton | Y | Y | Y | Y | N | Y | N |
| Mooroolbark | Y | Y | Y | Y | N | Y | N |
| Point Cook | Y | Y | Y | Y | N | Y | N |
| Traralgon | Y | Y | Y | Y | N | Y | N |
Table 3: EPA NEPM monitoring methods
| Pollutant | Australian Standard | Measurement technique |
|---|---|---|
| Carbon monoxide (CO) | Australian Standard 3580.7.1 Ambient air - Determination of carbon monoxide, direct instrumental method | Gas filter correlation/infrared |
| Nitrogen dioxide (NO2) | Australian Standard 3580.5.1 Ambient air – Determination of oxides of nitrogen – Direct reading instrument method | Gas phase chemiluminescence |
| Photochemical oxidant (ozone) (O3) | Australia Standard 3580.6.1 Ambient air — Determination of ozone — Direct reading instrument method | Non-dispersive ultraviolet |
| Sulfur dioxide (SO2) | Australian Standard 3580.4.1 Ambient air – Determination of sulfur dioxide – Direct reading instrument method | Pulsed fluorescence |
| Particles less than 10µm (PM10) | Australian Standard 3580.9.8 Determination of suspended particulate matter – PM10 continuous direct mass method using a tapered element oscillating microbalance analyser | Tapered element oscillating microbalance (TEOM) |
| Particles less than 2.5µm (PM2.5) | Australian Standard 3580.9.12 Determination of suspended particulate matter PM2.5 beta attenuation monitors | Beta attenuation monitors (BAM) |
| Particles less than 2.5µm (PM2.5) | Australian Standard 3580.9.10 Determination of suspended particulate matter – PM2.5 low volume sampler – Gravimetric method | Gravimetric reference method |
Assessment of air quality compliance with standards and goal 2020
Air quality is assessed against the standards defined in the Measure and the associated goals shown in Table 4. The goal of the Measure is to achieve the National Environment Protection Standards as assessed in accordance with the monitoring protocol to the extent specified in Schedule 2 of the Measure. The extent is expressed as a maximum allowable number of exceedances for each standard (shown in column four of Table 4).
The number of allowable exceedances associated with the standards has been set to account for unusual meteorological conditions. In the case of particles, allowable exceedances include exceptional events such as bushfires, hazard reduction burning (if authorised by state jurisdiction) or continental-scale windblown dust that cannot be controlled through normal air quality management strategies. Air quality monitoring data from each monitoring site are assessed against the Measure’s standards and the associated goals for each pollutant.
Compliance with the Measure requires that air quality standards are not exceeded more than the allowable number (as outlined in Schedule 2 of the Measure). Compliance with the Measure also requires that a minimum of 75 per cent of data are available for each quarter in the year. Regions are deemed to meet the Measure’s standards and goal if previous screening has shown that pollution levels are consistently below air quality standards and monitoring is therefore not required. In this way, lead is deemed to meet the Measure’s standards and goals, because lead was shown to be consistently below the Measure’s standards, due to the introduction of unleaded fuel in 1985. As a consequence, EPA stopped monitoring for lead in 2004.
The Measure’s goals for carbon monoxide, nitrogen dioxide, ozone, sulfur dioxide, PM10, PM2.5 and lead must be below the standards within the extent specified, such as taking into consideration exceptional events as described in the Measure. EPA uses a green, amber & red traffic light system to indicate compliance.
- Met– standard and goal achieved
- Not Met* – standard and goal not achieved due to insufficient data capture.
- Not Met – standard and goal not achieved.
Table 4: Air quality standards and goals in the Measure
| Pollutant | Averaging period | Standard | Goal max allowable exceedances |
|---|---|---|---|
| Carbon monoxide | 8 hours | 9.0 ppm | 1 day a year |
| Nitrogen dioxide | 1 hour | 120 ppb | 1 day a year |
| Nitrogen dioxide | 1 year | 30 ppb | None |
| Photochemical oxidant (ozone) | 1 hour | 100 ppb | 1 day a year |
| Photochemical oxidant (ozone) | 4 hours | 80 ppb | 1 day a year |
| Sulfur dioxide | 1 hour | 200 ppb | 1 day a year |
| Sulfur dioxide | 1 day | 80 ppb | 1 day a year |
| Sulfur dioxide | 1 year | 20 ppb | None |
| Particles less than 10 µm | 1 day | 50 µg/m3 | None |
| Particles less than 10 µm | 1 year | 25 µg/m3 | None |
| Particles less than 2.5 µm | 1 day | 25 µg/m3 | None |
| Particles less than 2.5 µm | 1 year | 8 µg/m3 | None |
| Lead | 1 year | 0.50 µg/m3 | None |
| Note: | |||
| For PM2.5, there is an additional goal to further reduce concentrations to below a daily concentration of 20 μg/m3 and an annual concentration of 7 μg/m3 by 2025. |
2.1 Particles (PM2.5)
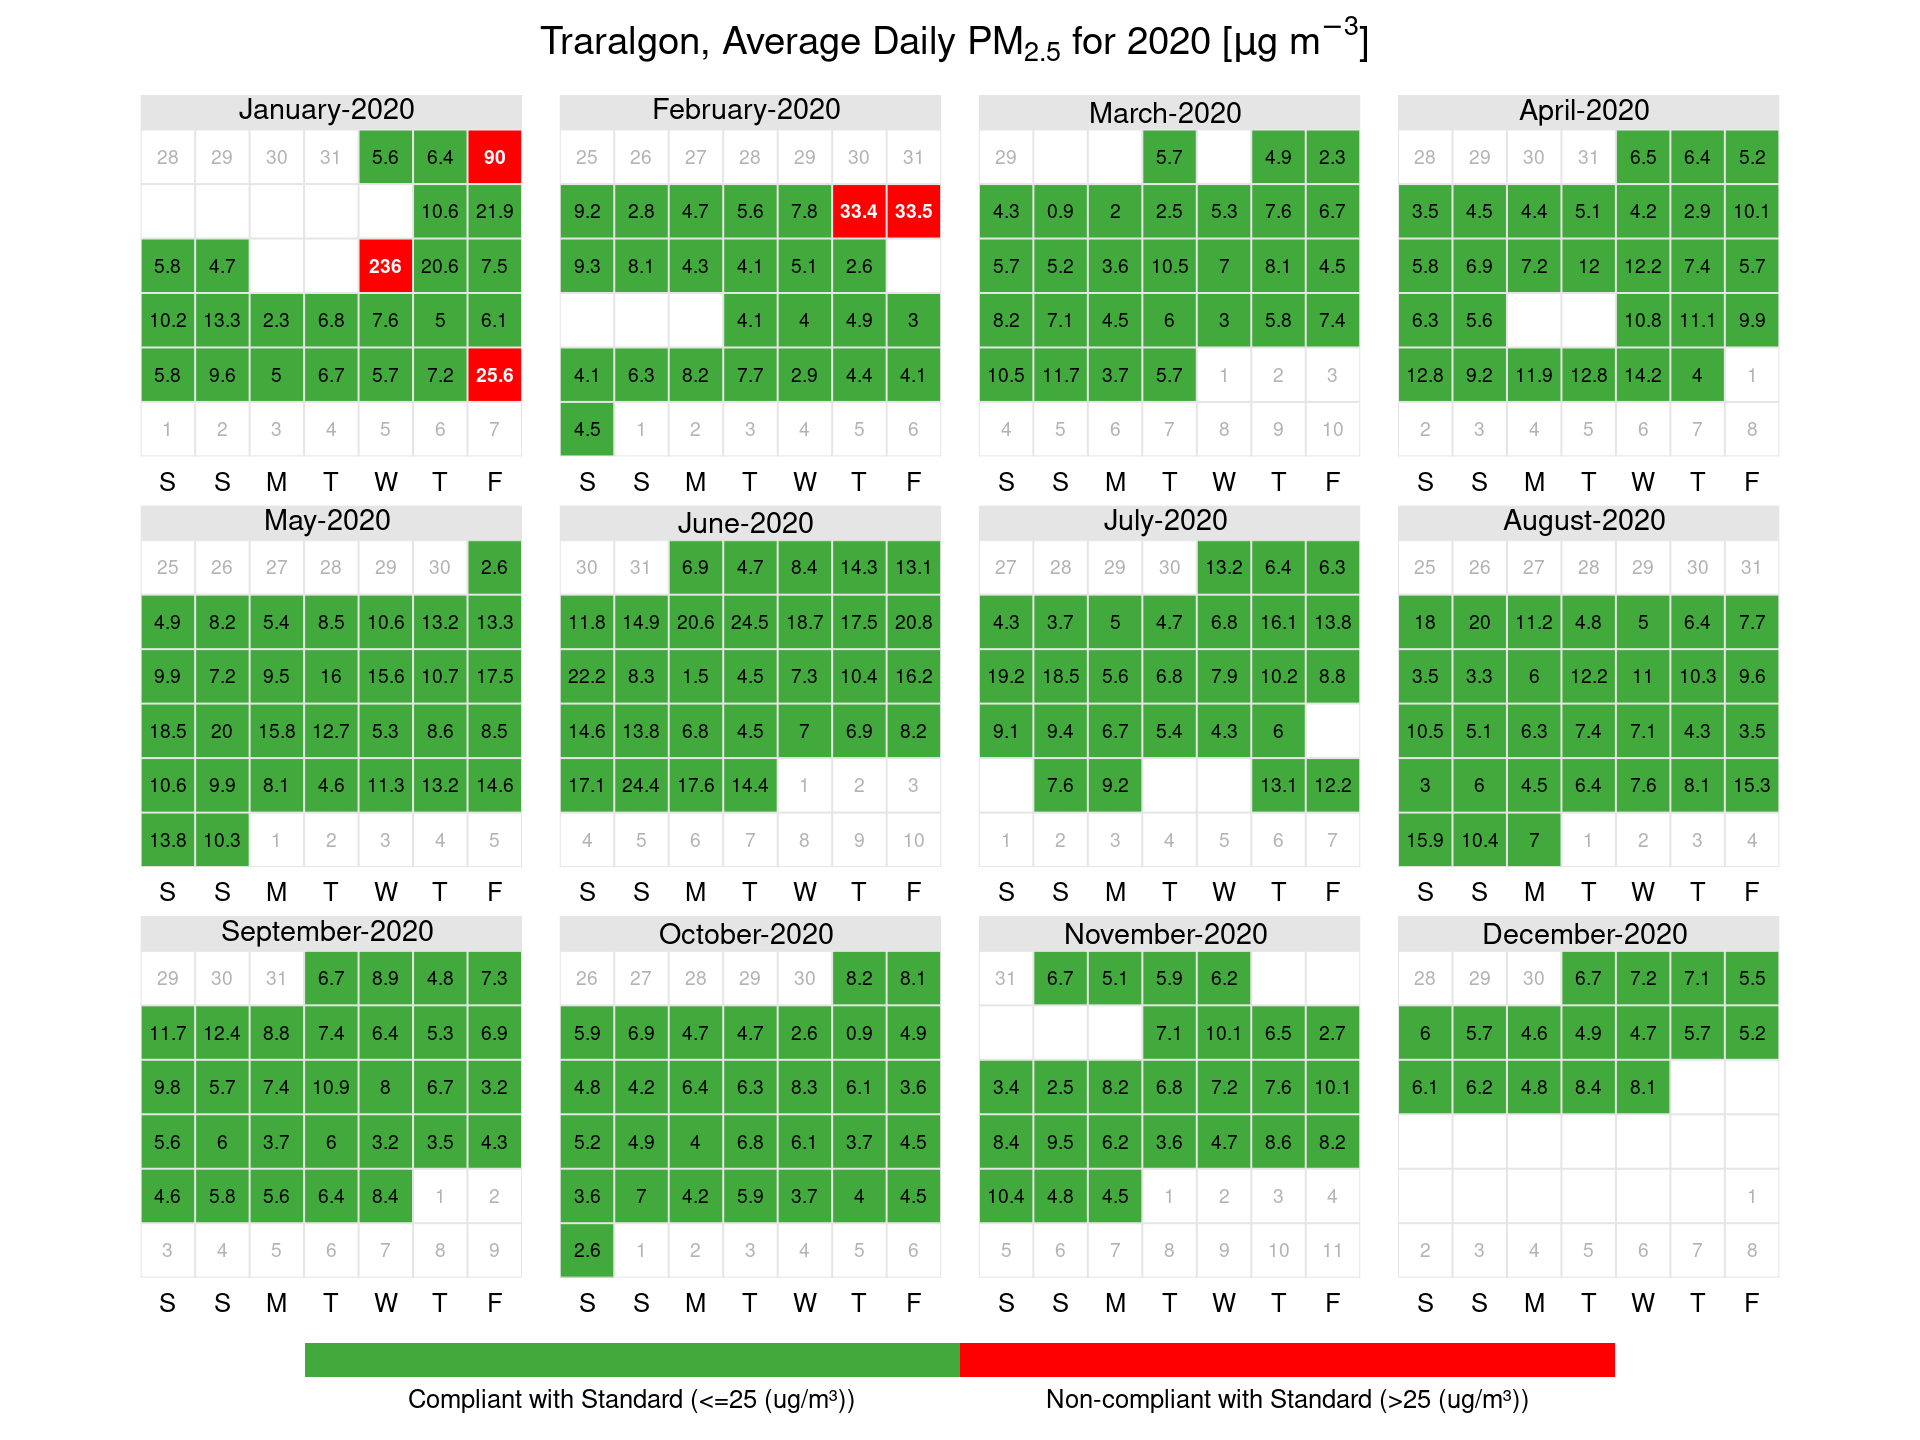
In Victoria, PM2.5 is assessed against a daily standard of 25 µg/m3, with a goal of zero exceedance days allowed per year, excluding exceptional events such as bushfires and authorised hazard reduction burning. PM2.5 is also assessed against an annual standard of 8 µg/m3 as shown in Table 5. Table 6 shows the highest recorded concentration for each monitoring station. In 2020 there were multiple exceedances recorded on PM2.5 instruments across EPA’s network. As a result, the standards and goal for PM2.5 were not met. Most of the exceedances were due to major bushfire events in Quarter 1 (Q1; January and February 2020), with several exceedances also associated with hazard reduction burns and wood heater smoke in Quarter 2 and Quarter 3 (Q2 and Q3). There were also data losses at Alphington and Geelong monitoring stations for PM2.5.
- At Alphington, there were 15 days where the standard was exceeded, however for the purpose of NEPM reporting only 7 days were reported. This was due to a failed flow audit in Q1 that meant that data was considered invalid, the data collected during this time included 7 exceedances caused by smoke from major bushfires that occurred in January 2020. A potential exceedance of the standard was also recorded on 4 October 2020, however this was identified during the data validation process as being due to pollen entering the sampling inlet, data collected for PM10 at Alphington was significantly lower than the PM2.5 reading, as a result, this day has been excluded from the validated dataset.**
- At Geelong, the main detector in the instrument failed, and as a result there was less data collected during Q1.
Table 5: PM2.5 compliance data for 2020
| Q1 | Q2 | Q3 | Q4 | Annual | 24hr (days) | (µg/m3) | ||
|---|---|---|---|---|---|---|---|---|
| Alphington | 28.66 | 97.59 | 88.23 | 96.24 | 77.91 | 7 | 7.84 | Not met |
| Footscray | 95.32 | 98.61 | 98.63 | 97.89 | 97.64 | 8 | 8.47 | Not met |
| Geelong South | 71.02 | 96.21 | 98.86 | 82.68 | 87.31 | 6 | 7.78 | Not met |
| Melbourne CBD | 92.36 | 97.92 | 99.27 | 99.08 | 97.19 | 10 | 7.84 | Not met |
| Traralgon | 91.2 | 98.47 | 97.57 | 79.43 | 91.7 | 5 | 8.99 | Not met |
Table 6: 24hr PM2.5 highest and second highest concentrations for 2020
| PM2.5 (µg/m3) | Date | PM2.5 (µg/m3) | Date | ||
|---|---|---|---|---|---|
| Alphington | 280 | 35.66 | 28/06/2020 | 30.1 | 26/07/2020 |
| Footscray | 351 | 204.5 | 14/01/2020 | 111.02 | 15/01/2020 |
| Geelong South | 315 | 155.05 | 15/01/2020 | 132.7 | 14/01/2020 |
| Melbourne CBD | 355 | 196.31 | 14/01/2020 | 80.28 | 15/01/2020 |
| Traralgon | 326 | 236 | 15/01/2020 | 89.97 | 03/01/2020 |
2.2 Particles (PM10)
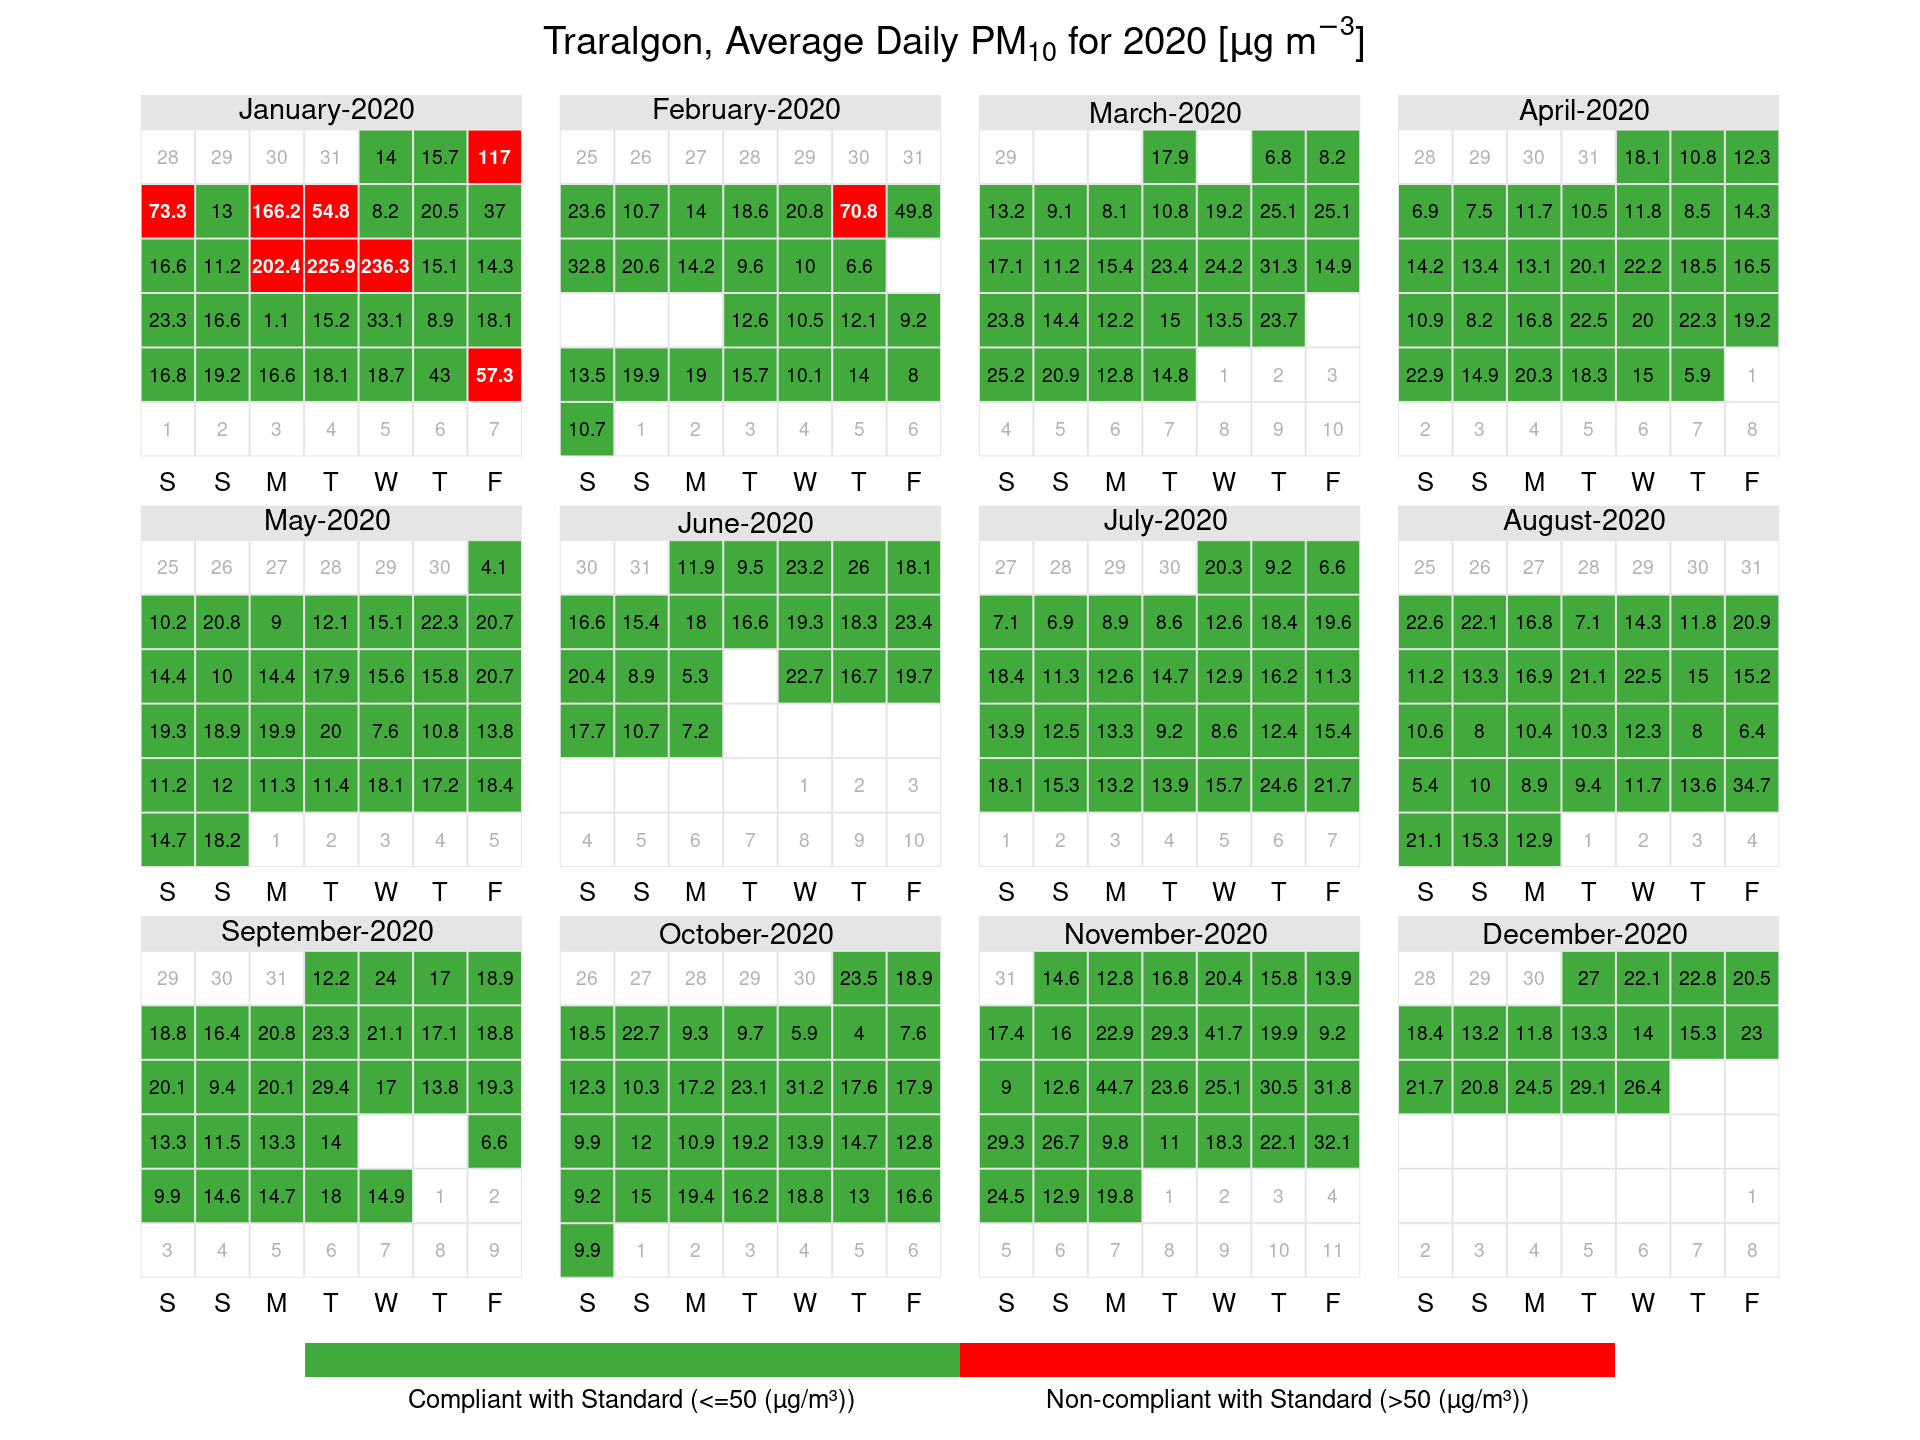
In Victoria, PM10 is assessed against a daily standard of 50 µg/m3, with a goal of zero exceedance days allowed per year, excluding exceptional events such as continental scale dust storms. PM10 is also assessed against an annual standard of 25 µg/m3 as shown in Table 7. Table 8 shows the highest recorded concentration for each monitoring station.
In 2020 there were multiple exceedances recorded across the PM10 network, as a result, the standards and goal were not met. Most of the exceedances were due to major bushfire events in Quarter 1, with one exceedance at Footscray in Quarter 4 associated with strong winds and dust. There were also data losses for PM10 at Footscray in Quarter 1 and Geelong in Quarter 2 and Quarter 4 for PM10.
- At Footscray, a sensor fault in Quarter 1 was detected during routine audits. This meant that some data were invalidated back to the prior audit.
- At Geelong, EPA replaced the instrument in Quarter 2 which resulted in some data being invalidated. A temperature sensor fault in Quarter 4 also resulted in some data being invalidated.
Table 7: PM10 compliance data for 2020
| Q1 | Q2 | Q3 | Q4 | Annual | 24hr (days) | (µg/m3) | ||
|---|---|---|---|---|---|---|---|---|
| Alphington | 98.38 | 91.44 | 88.51 | 95.83 | 93.55 | 7 | 19.38 | Not met |
| Dandenong | 88.43 | 91.53 | 95.74 | 97.39 | 93.21 | 9 | 20.56 | Not met |
| Footscray | 56.94 | 98.66 | 98.26 | 97.94 | 88.11 | 1 | 16.82 | Not met |
| Geelong South | 94.44 | 38.18 | 76.19 | 73.71 | 70.45 | 6 | NA | Not met |
| Mooroolbark | 79.12 | 88.71 | 97.34 | 97.94 | 90.89 | 4 | 15.66 | Not met |
| Traralgon | 94.72 | 91.39 | 98.17 | 83.74 | 91.89 | 9 | 20.87 | Not met |
Table 8: 24-hour PM10 highest concentration for 2020
| PM10 (µg/m3) | Date | PM10 (µg/m3) | Date | ||
|---|---|---|---|---|---|
| Alphington | 338 | 226.48 | 14/01/2020 | 98.02 | 15/01/2020 |
| Dandenong | 334 | 259.12 | 14/01/2020 | 134.21 | 15/01/2020 |
| Footscray | 320 | 50.95 | 16/11/2020 | 42.29 | 07/02/2020 |
| Geelong South | 254 | 199.41 | 15/01/2020 | 167.19 | 13/01/2020 |
| Mooroolbark | 326 | 71.37 | 06/01/2020 | 61.69 | 31/01/2020 |
| Traralgon | 332 | 236.31 | 15/01/2020 | 225.93 | 14/01/2020 |
2.3 Carbon monoxide (CO)
In Victoria, carbon monoxide is assessed against an eight-hour standard of 9.0 ppm, with one exceedance day allowed per year as shown in Table 9. Table 10 shows the highest recorded concentration for each monitoring station.
In 2020 there were no exceedances of the carbon monoxide standard. As a result, the standards and goal for carbon monoxide were met.
Table 9: Carbon monoxide compliance data for 2020
| Q1 | Q2 | Q3 | Q4 | Annual | 8hr (days) | ||
|---|---|---|---|---|---|---|---|
| Alphington | 92.64 | 87.32 | 82.23 | 94.87 | 87.98 | 0 | Met |
| Footscray | 93.84 | 89.77 | 93.82 | 94.04 | 91.71 | 0 | Met |
| Geelong South | 93.33 | 85.1 | 93.96 | 79.29 | 86.82 | 0 | Met |
| Traralgon | 90.83 | 83.11 | 94.32 | 79.16 | 85.96 | 0 | Met |
Table 10: 8-hour carbon monoxide highest and second highest concentration for 2020
| CO (ppm) | Date | CO (ppm) | Date | ||
|---|---|---|---|---|---|
| Alphington | 324 | 2.25 | 06/01/2020 | 1.46 | 11/06/2020 |
| Footscray | 339 | 2.84 | 14/01/2020 | 2.7 | 06/01/2020 |
| Geelong South | 322 | 3.04 | 14/01/2020 | 2.9 | 13/01/2020 |
| Traralgon | 319 | 4.94 | 06/01/2020 | 3.79 | 15/01/2020 |
2.4 Nitrogen dioxide (NO2)
In Victoria, nitrogen dioxide is assessed against a one-hour standard of 120 ppb, with one exceedance a day allowed per year and an annual standard of 30 ppb, with no exceedances allowed as shown in Table 11. Table 12 shows the highest recorded concentration for each monitoring station.
In 2020 there were no exceedances of the nitrogen dioxide standards. As a result, the standards and goal for nitrogen dioxide were met.
Table 11: Nitrogen dioxide compliance data for 2020
| Q1 | Q2 | Q3 | Q4 | Annual | 1hr (days) | (ppb) | 1hr | Annual | |
|---|---|---|---|---|---|---|---|---|---|
| Alphington | 94.31 | 94.22 | 84.48 | 94.92 | 91.99 | 0 | 8.2 | Met | Met |
| Footscray | 93.84 | 94.22 | 94.92 | 94.09 | 94.28 | 0 | 9.84 | Met | Met |
| Geelong South | 93.33 | 94.63 | 94.41 | 79.43 | 90.45 | 0 | 5.68 | Met | Met |
| Traralgon | 90.83 | 93.57 | 94.64 | 79.8 | 89.75 | 0 | 6.01 | Met | Met |
Table 12: One-hour nitrogen dioxide highest and second highest concentrations for 2020
| Monitoring station | Valid days | Highest day | Next highest day | ||
|---|---|---|---|---|---|
| CO (ppm) | Date | CO (ppm) | Date | ||
| Alphington | 348 | 51.5 | 30/01/2020 | 51.3 | 21/11/2020 |
| Footscray | 358 | 64.8 | 30/01/2020 | 56.9 | 15/01/2020 |
| Geelong South | 342 | 52.8 | 15/01/2020 | 45 | 24/07/2020 |
| Traralgon | 340 | 32 | 31/01/2020 | 29.2 | 14/01/2020 |
2.5 Ozone (O3)
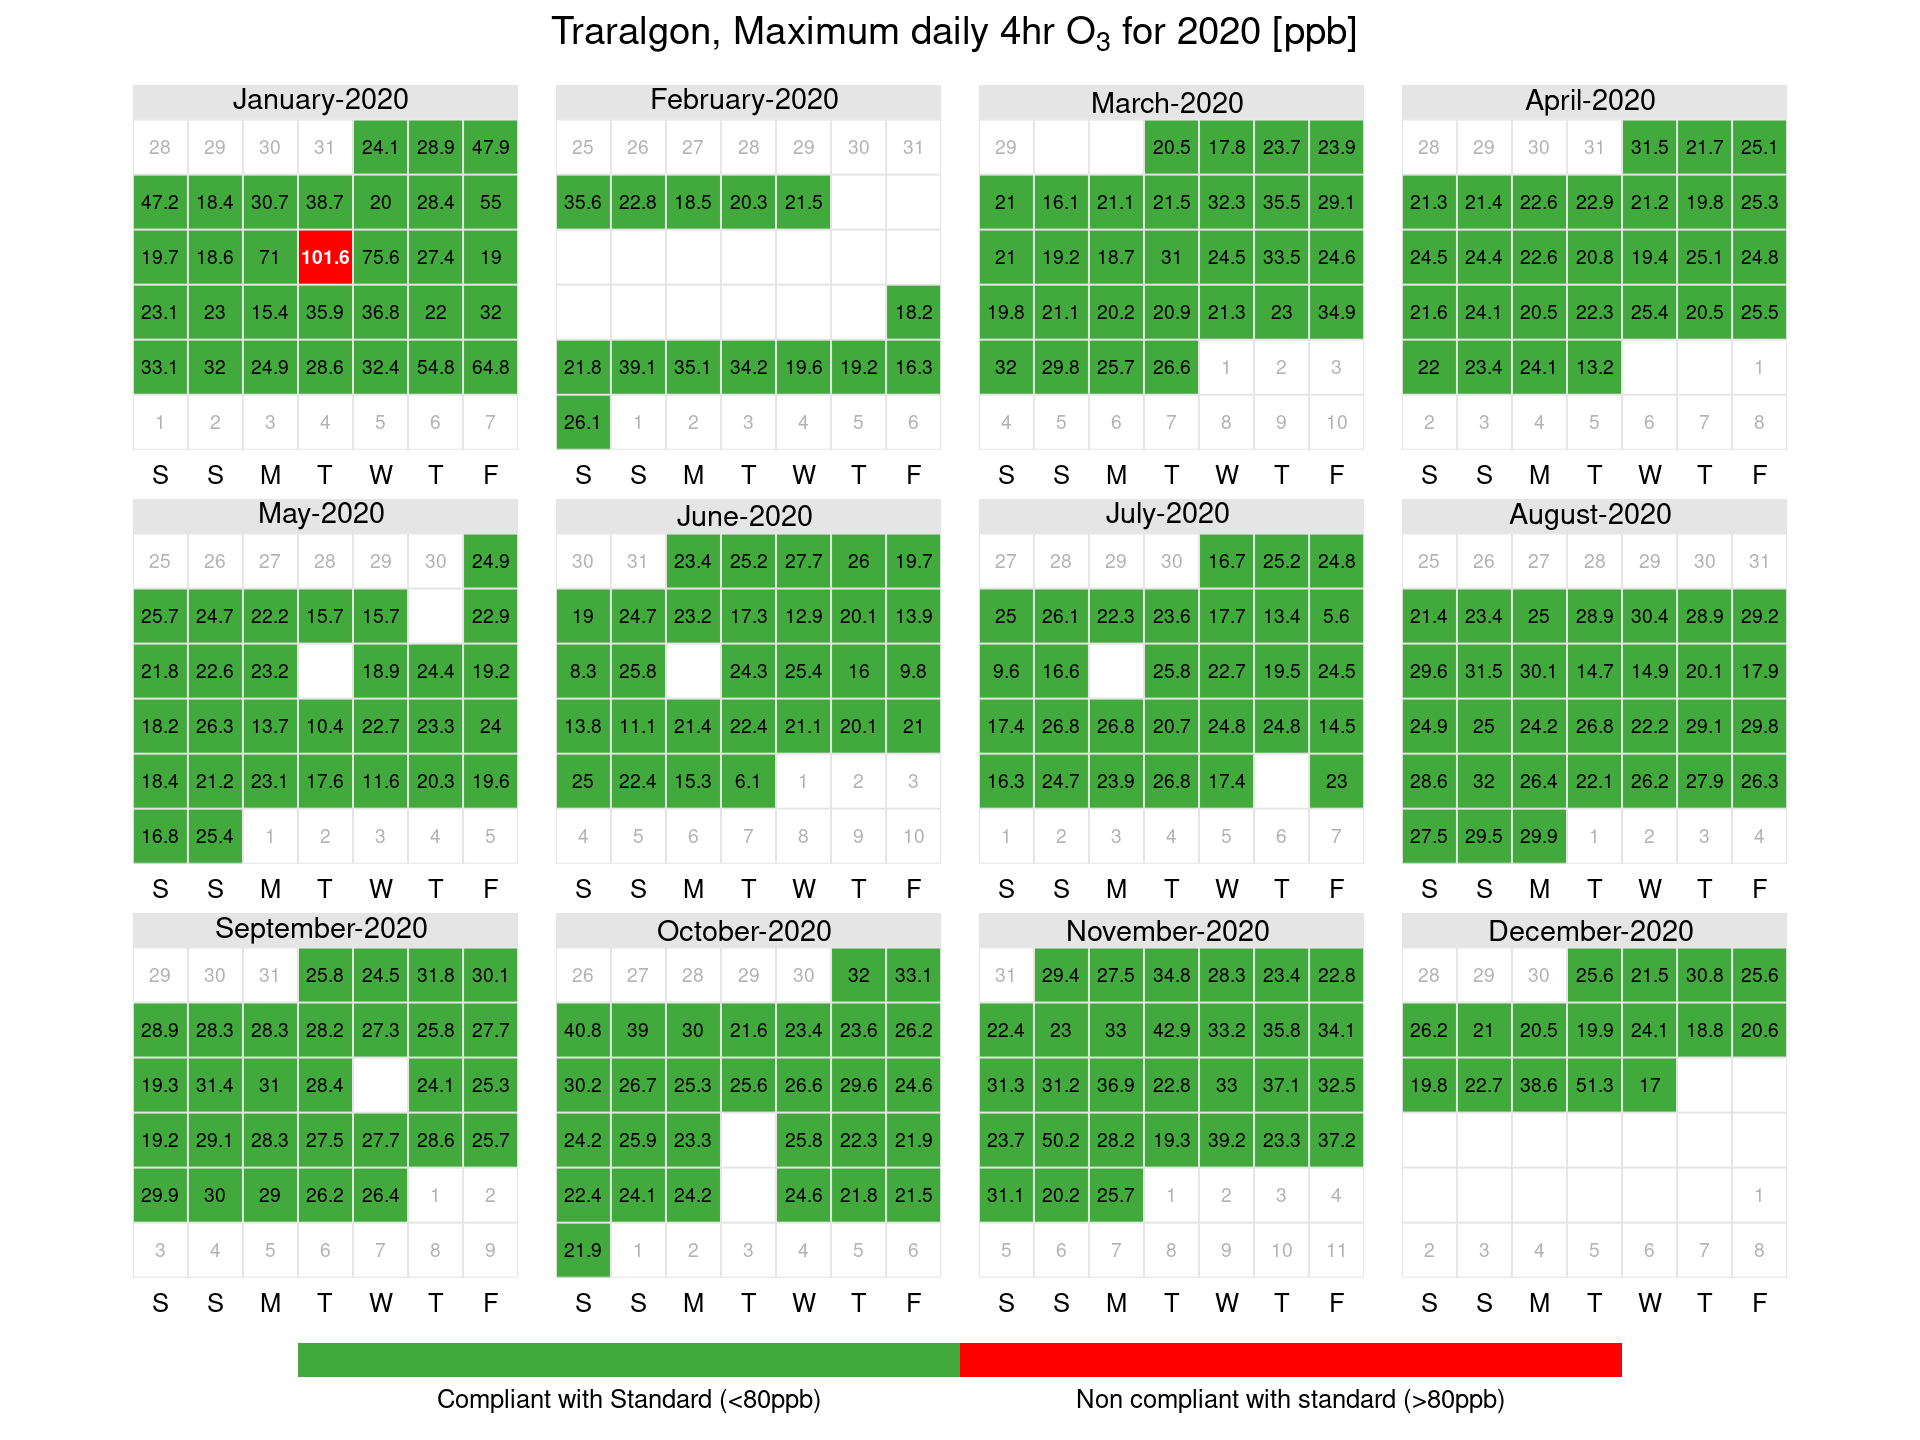
In Victoria, ozone is assessed against a one-hour standard of 100 ppb and a four-hour standard of 80 ppb, with one exceedance day allowed per year as shown in Table 13. Tables 14 and 15 show the highest recorded concentrations for each monitoring station.
In 2020 there were multiple exceedances recorded on ozone instruments across EPA’s network. As a result, with the exception of Alphington and Traralgon, the standards and goal for ozone were not met.
While there were no exceedances of the ozone standard recorded at Point Cook, the station did not meet the goal as there was less than 75% data capture in Quarter 1 and overall for the year. This was related to power supply issues at the site which required the site owner to replace a power transformer.
Table 13: Ozone compliance data for 2020
| Q1 | Q2 | Q3 | Q4 | Annual | 1hr | 4hr | 1hr | 4hr | |
|---|---|---|---|---|---|---|---|---|---|
| Alphington | 94.49 | 94.31 | 83.52 | 94.92 | 91.82 | 1 | 1 | Met | Met |
| Dandenong | 94.54 | 94.72 | 94.09 | 95.01 | 94.57 | 1 | 2 | Met | Not Met |
| Footscray | 93.84 | 94.26 | 94.83 | 95.1 | 94.52 | 2 | 2 | Not Met | Not Met |
| Geelong South | 92.82 | 94.63 | 94.51 | 79.89 | 90.46 | 1 | 2 | Met | Not Met |
| Melton | 90.14 | 95.19 | 90.57 | 92.35 | 92.09 | 2 | 3 | Not Met | Not Met |
| Point Cook | 0 | 36.51 | 95.01 | 95.24 | 56.95 | 0 | 0 | Not Met* | Not Met* |
| Traralgon | 78.98 | 93.75 | 94.64 | 79.8 | 86.87 | 1 | 1 | Met | Met |
Table 14: One-hour ozone highest and second highest concentrations for 2020
| 1hr O3 (ppb) | Date | 1hr O3 (ppb) | Date | ||
|---|---|---|---|---|---|
| Alphington | 347 | 129.2 | 14/01/2020 | 95.1 | 09/01/2020 |
| Dandenong | 359 | 110.9 | 14/01/2020 | 85.6 | 03/01/2020 |
| Footscray | 359 | 117.1 | 03/01/2020 | 112.7 | 14/01/2020 |
| Geelong South | 343 | 113.9 | 15/01/2020 | 93.7 | 13/01/2020 |
| Melton | 348 | 128.3 | 03/01/2020 | 115.6 | 14/01/2020 |
| Point Cook | 218 | 55.6 | 22/11/2020 | 55.1 | 02/11/2020 |
| Traralgon | 329 | 107.5 | 14/01/2020 | 83.8 | 15/01/2020 |
Table 15: Four-hour ozone highest and second highest concentration for 2020
| 4hr O3 (ppb) | Date | 4hr O3 (ppb) | Date | ||
|---|---|---|---|---|---|
| Alphington | 340 | 119.15 | 14/01/2020 | 78.33 | 03/01/2020 |
| Dandenong | 355 | 98 | 14/01/2020 | 80.7 | 03/01/2020 |
| Footscray | 353 | 108.38 | 03/01/2020 | 102.08 | 14/01/2020 |
| Geelong South | 342 | 95.5 | 15/01/2020 | 89.4 | 13/01/2020 |
| Melton | 344 | 119.35 | 03/01/2020 | 105.75 | 14/01/2020 |
| Point Cook | 217 | 50.55 | 22/11/2020 | 47.97 | 21/11/2020 |
| Traralgon | 324 | 101.55 | 14/01/2020 | 75.55 | 15/01/2020 |
2.6 Sulfur dioxide (SO2)
In Victoria, sulfur dioxide is assessed against a one-hour standard of 200 ppb, a daily standard of 80 ppb and an annual standard of 20 ppb, with one exceedance day allowed per year as shown in Table 16. Tables 17 and 18 show the highest recorded concentrations for each monitoring station.
In 2020 there were no exceedances recorded on sulfur dioxide instruments across EPA’s network. As a result, the standards and goal were met at Alphington and Traralgon.
Compliance was not met at Altona North and Geelong South due to less than 75% data capture.
- For Altona North, this was due to EPA relocation the station to a new site due to the end of a long term lease agreement.
- For Geelong, there was a major fault with the instrument and a replacement instrument was not immediately available as the supplier was undertaking acceptance testing of the new instruments.
Table 16: Sulfur dioxide compliance data for 2020
| Q1 | Q2 | Q3 | Q4 | Annual | 1hr (days) | 24hr (days) | (ppb) | 1hr | 24hr | Annual | |
|---|---|---|---|---|---|---|---|---|---|---|---|
| Alphington | 75.79 | 88.99 | 84.48 | 80.9 | 82.64 | 0 | 0 | 1.05 | Met | Met | Met |
| Altona North | 0 | 0 | 0 | 88.46 | 22.04 | 0 | 0 | 7.33 | Not Met* | Not Met* | Not Met* |
| Geelong South | 69.63 | 70.15 | 94.09 | 79.48 | 78.23 | 0 | 0 | 1.48 | Not Met* | Not Met* | Not Met* |
| Traralgon | 90.83 | 87 | 94.69 | 79.8 | 88.13 | 0 | 0 | 2.96 | Met | Met | Met |
Table 17: One-hour sulfur dioxide highest and second highest concentrations for 2020
| 1hr SO2 (ppb) | Date | 1hr SO2 (ppb) | Date | ||
|---|---|---|---|---|---|
| Alphington | 310 | 5.3 | 04/12/2020 | 5.1 | 03/05/2020 |
| Altona North | 85 | 43.6 | 17/10/2020 | 40.6 | 16/11/2020 |
| Geelong South | 295 | 27.4 | 28/06/2020 | 19.4 | 24/09/2020 |
| Traralgon | 334 | 30.8 | 05/02/2020 | 28.8 | 13/01/2020 |
Table 18: 24-hour sulfur dioxide highest and second highest concentration for 2020
| 24hr SO2 (ppb) | Date | 24hr SO2 (ppb) | Date | ||
|---|---|---|---|---|---|
| Alphington | 310 | 2.45 | 04/12/2020 | 2.37 | 30/11/2020 |
| Altona North | 85 | 9.61 | 17/10/2020 | 9.36 | 16/11/2020 |
| Geelong South | 295 | 2.64 | 24/09/2020 | 2.44 | 19/05/2020 |
| Traralgon | 334 | 5.56 | 05/02/2020 | 4.35 | 20/07/2020 |
Analysis of air quality monitoring 2020
The trends in air quality data across the year are analysed using a breakdown of daily concentration percentiles for the year for each parameter and station. This approach assesses how pollutant concentrations are distributed across the year. The use of percentiles is similar to expressing the data as the Nth highest value. For example, the 95th percentile of daily peak concentrations corresponds to the 18th highest daily peak concentration if there is 100% data availability. For pollutants and stations where exceedances have been recorded, calendar plots (Figures 3-7) have been included to show the temporal distribution for when the exceedances occurred.
3.1 Particles (PM2.5)
In 2020 the peak 24-hour PM2.5 measurement at a NEPM station was 204.5 µg/m3 at Footscray on 14 January 2020. A peak reading of 214 µg/m3 was also measured at Alphington on the same day, however due to an issue with the flow controller, this measurement was invalid.
As shown in Figures 3 to 7, there were exceedances of the 24-hour standard recorded during the year, most of these occurred during Quarter 1 and were associated with major bushfires which were impacting the south east coast of Australia. Seven exceedances were recorded during May, June and July at Alphington and on two days during June and July at Melbourne CBD which were attributed to local wood heater impacts.
Table 19: 24-hour PM2.5 percentiles for 2020
| (% days) | Max | 99th | 98th | 95th | 90th | 75th | 50th | |
|---|---|---|---|---|---|---|---|---|
| Alphington | 76.5 | 35.66 | 27.89 | 25.94 | 19.05 | 13.52 | 9.01 | 6.37 |
| Footscray | 95.9 | 204.5 | 63.05 | 29.86 | 17.59 | 12.92 | 8.34 | 5.79 |
| Geelong South | 86.07 | 155.05 | 66.48 | 23.39 | 15.01 | 11.71 | 7.78 | 5.5 |
| Melbourne CBD | 96.99 | 196.31 | 69.19 | 26.92 | 18.54 | 12.81 | 7.67 | 5.28 |
| Traralgon | 89.07 | 236 | 31.42 | 23.29 | 18.49 | 14.49 | 9.94 | 6.74 |
Figure 3: Alphington PM2.5 calendar plots showing days where exceedances of the average daily PM2.5 standard occurred in µg/m3
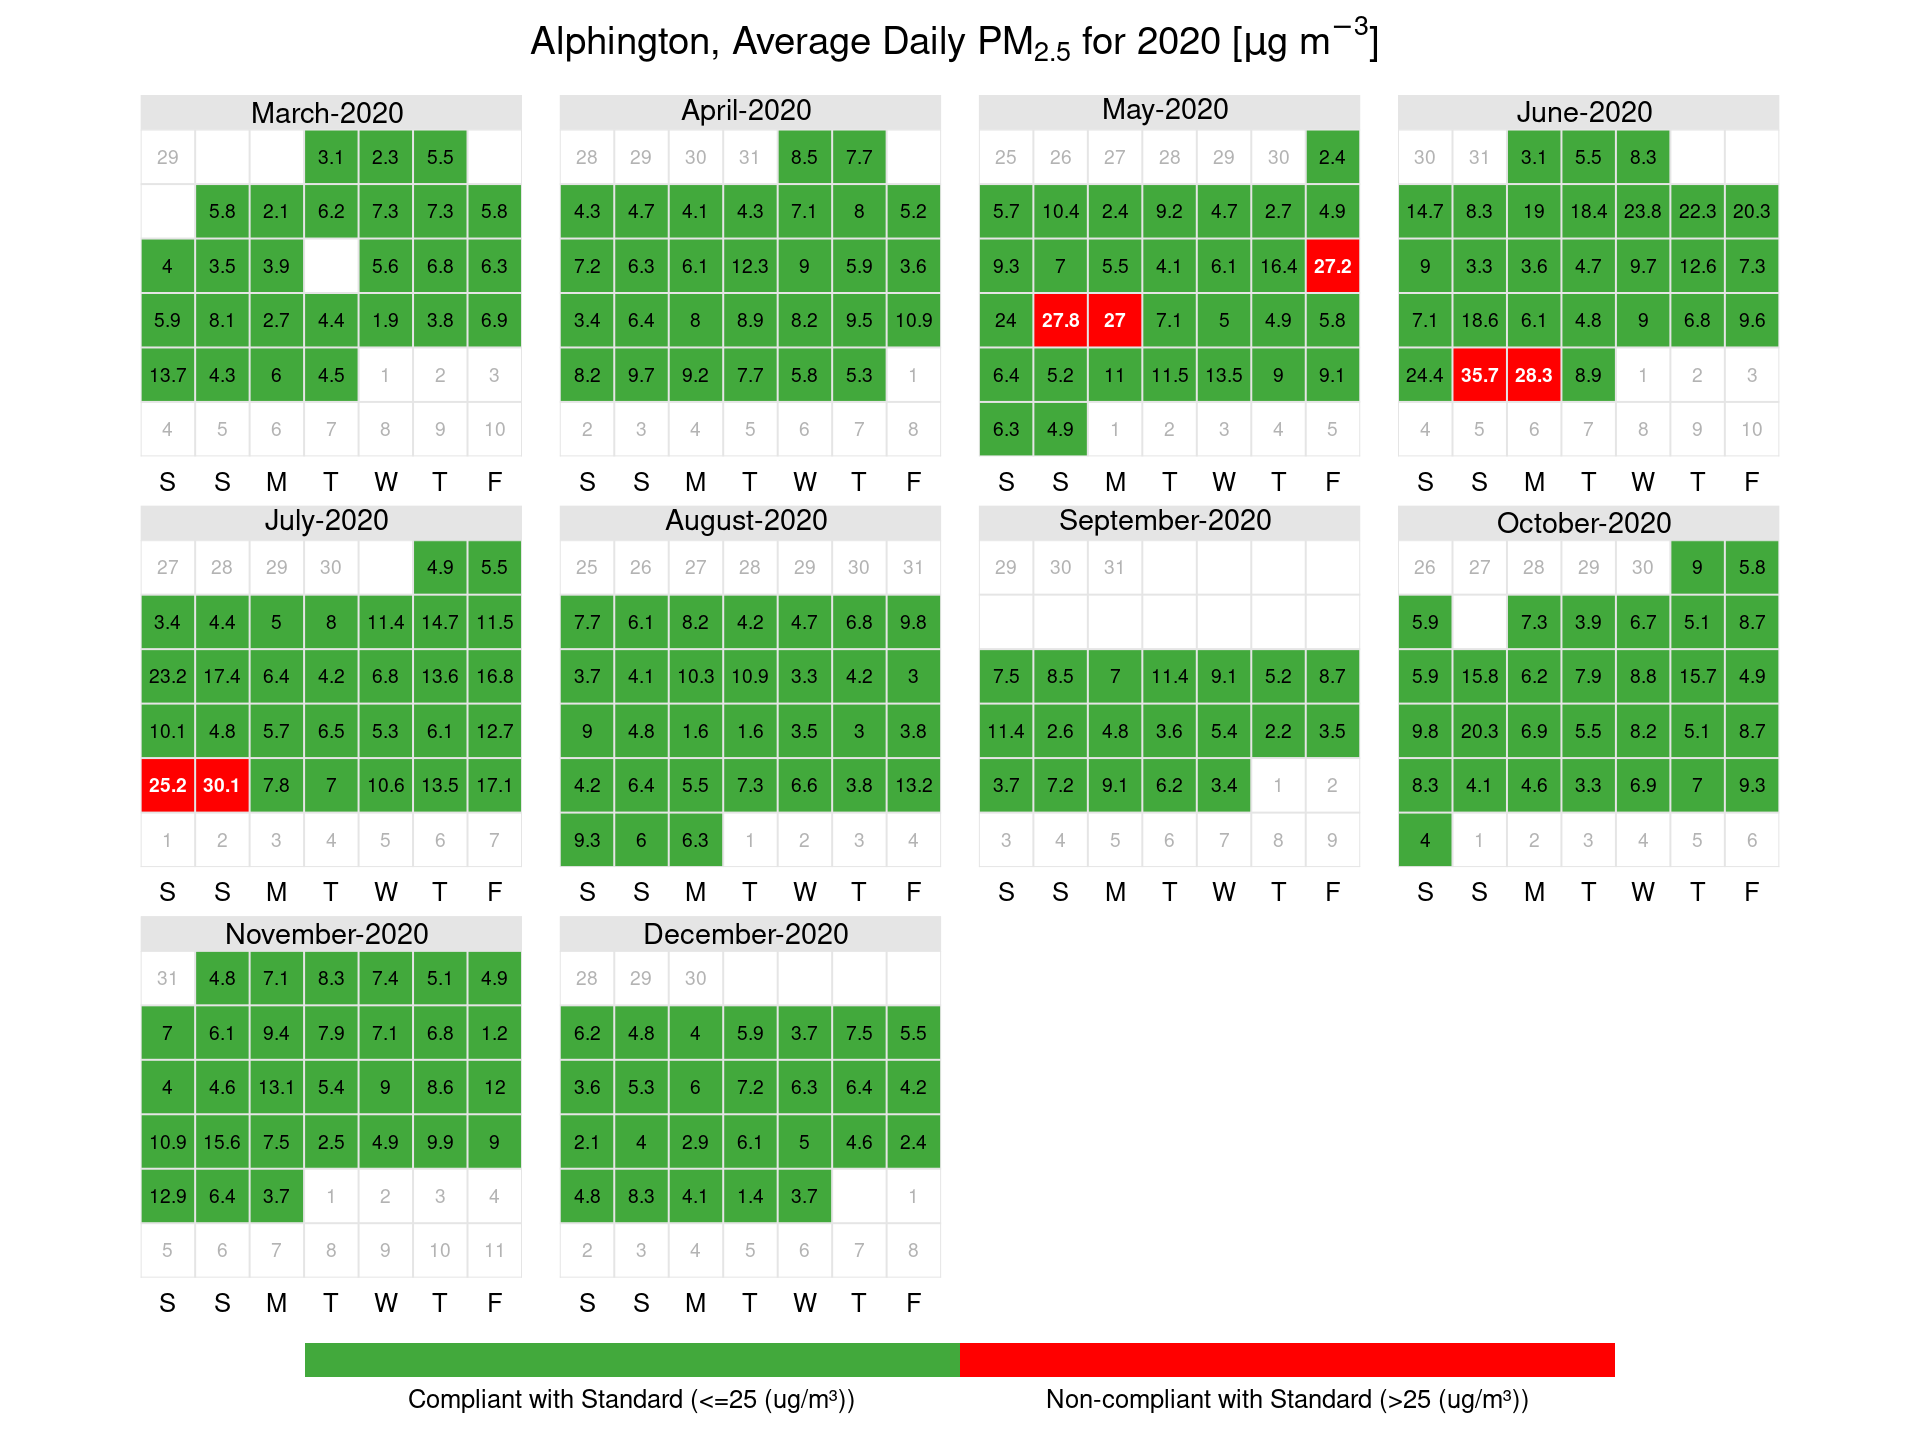
Figure 4: Footscray PM2.5 calendar plots showing days where exceedances of the average daily PM2.5 standard occurred in µg/m3
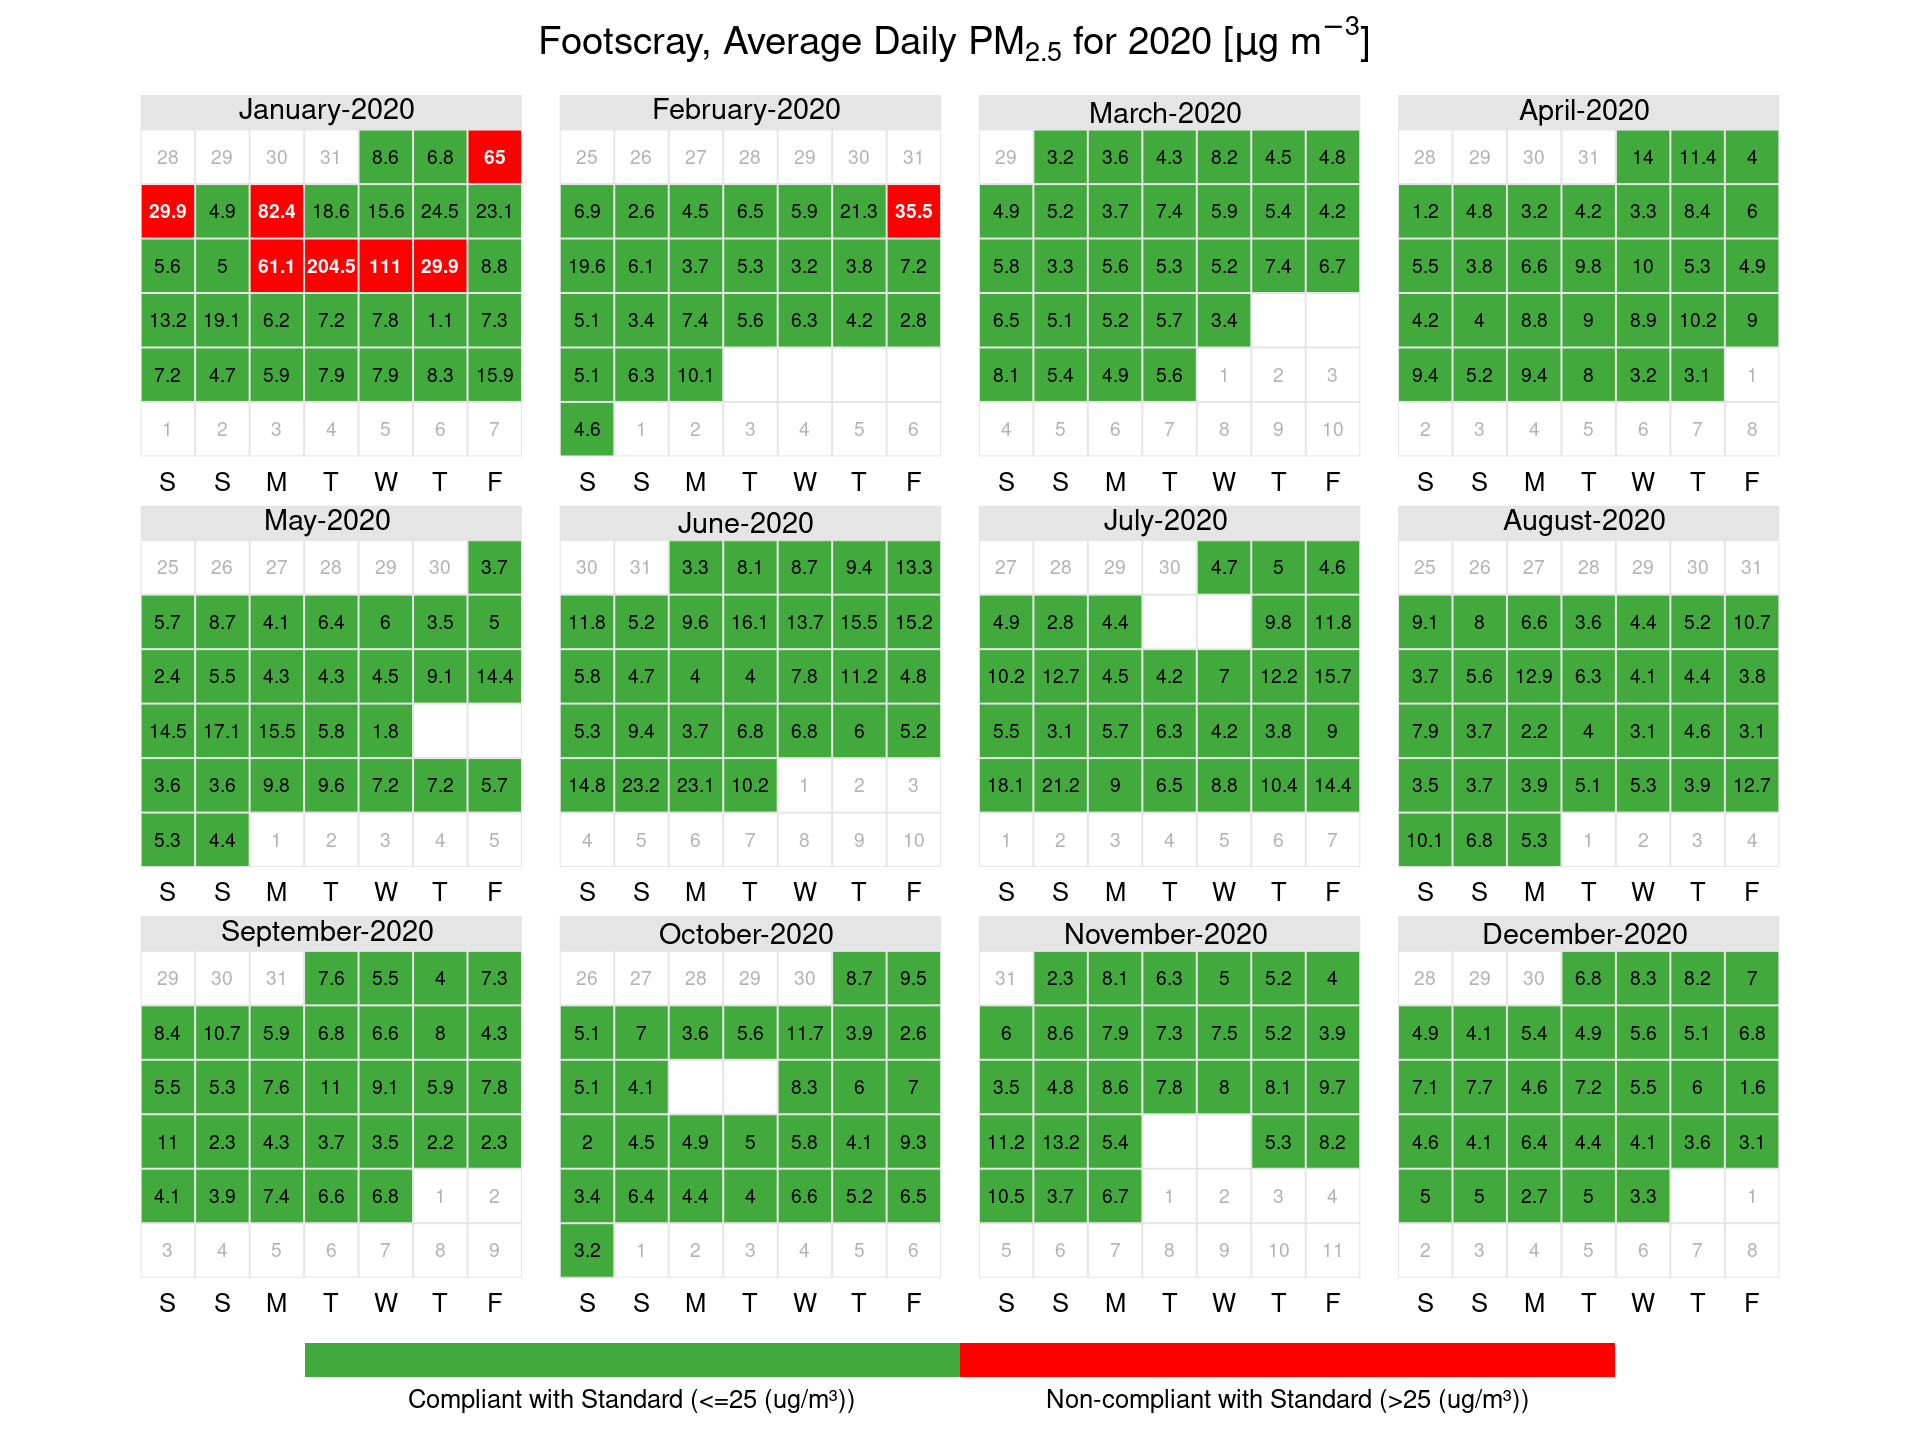
Figure 5: Geelong South PM2.5 calendar plots showing days where exceedances of the average daily PM2.5 standard occurred in µg/m3
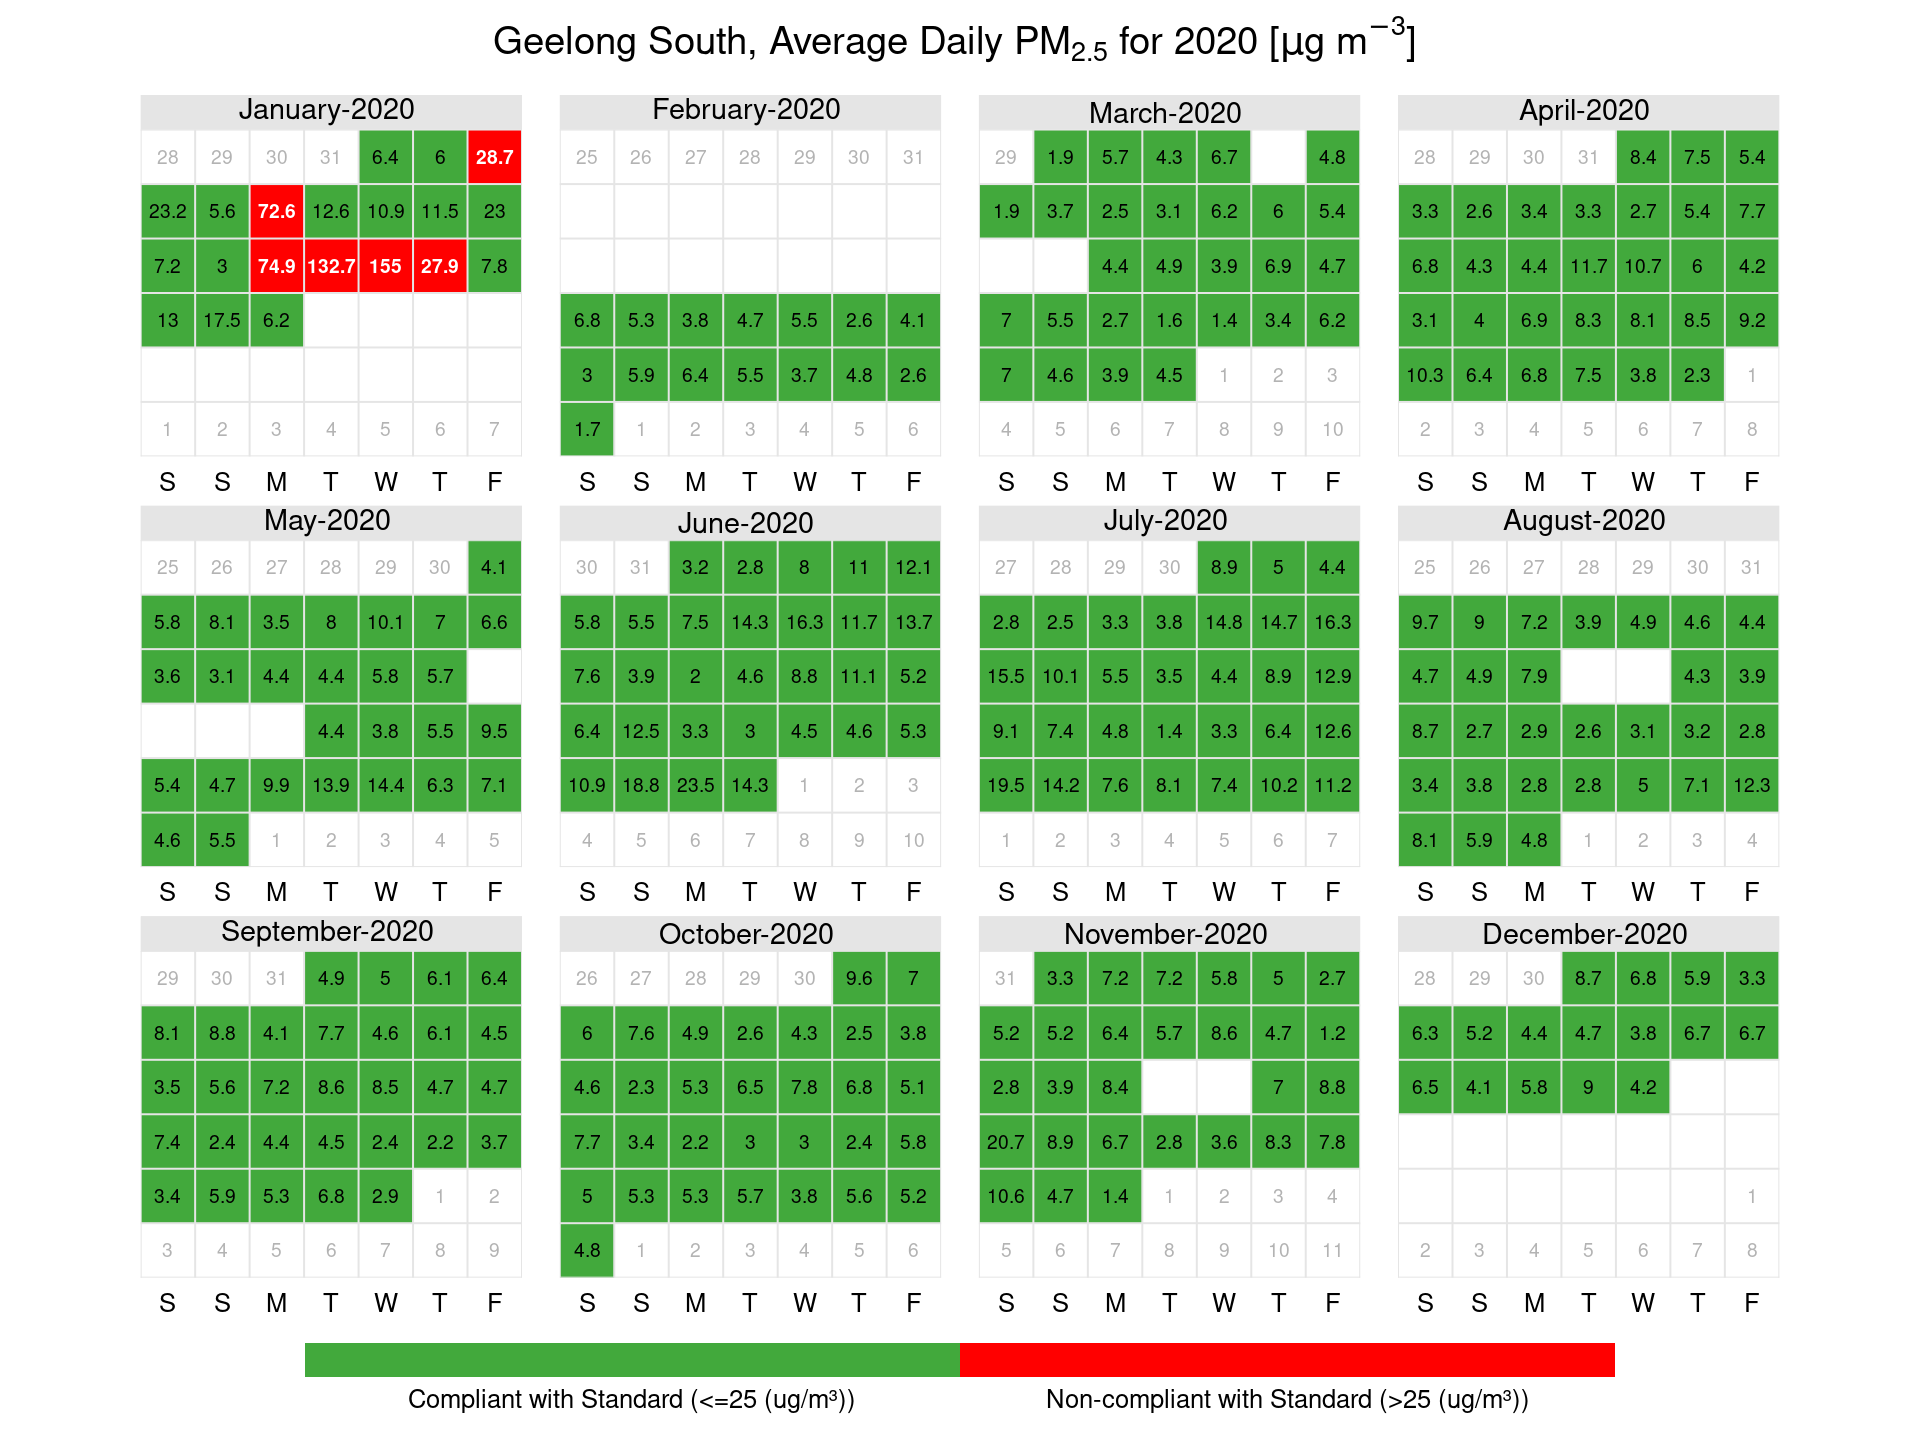
Figure 6: Melbourne CBD PM2.5 calendar plots showing days where exceedances of the average daily PM2.5 standard occurred in µg/m3
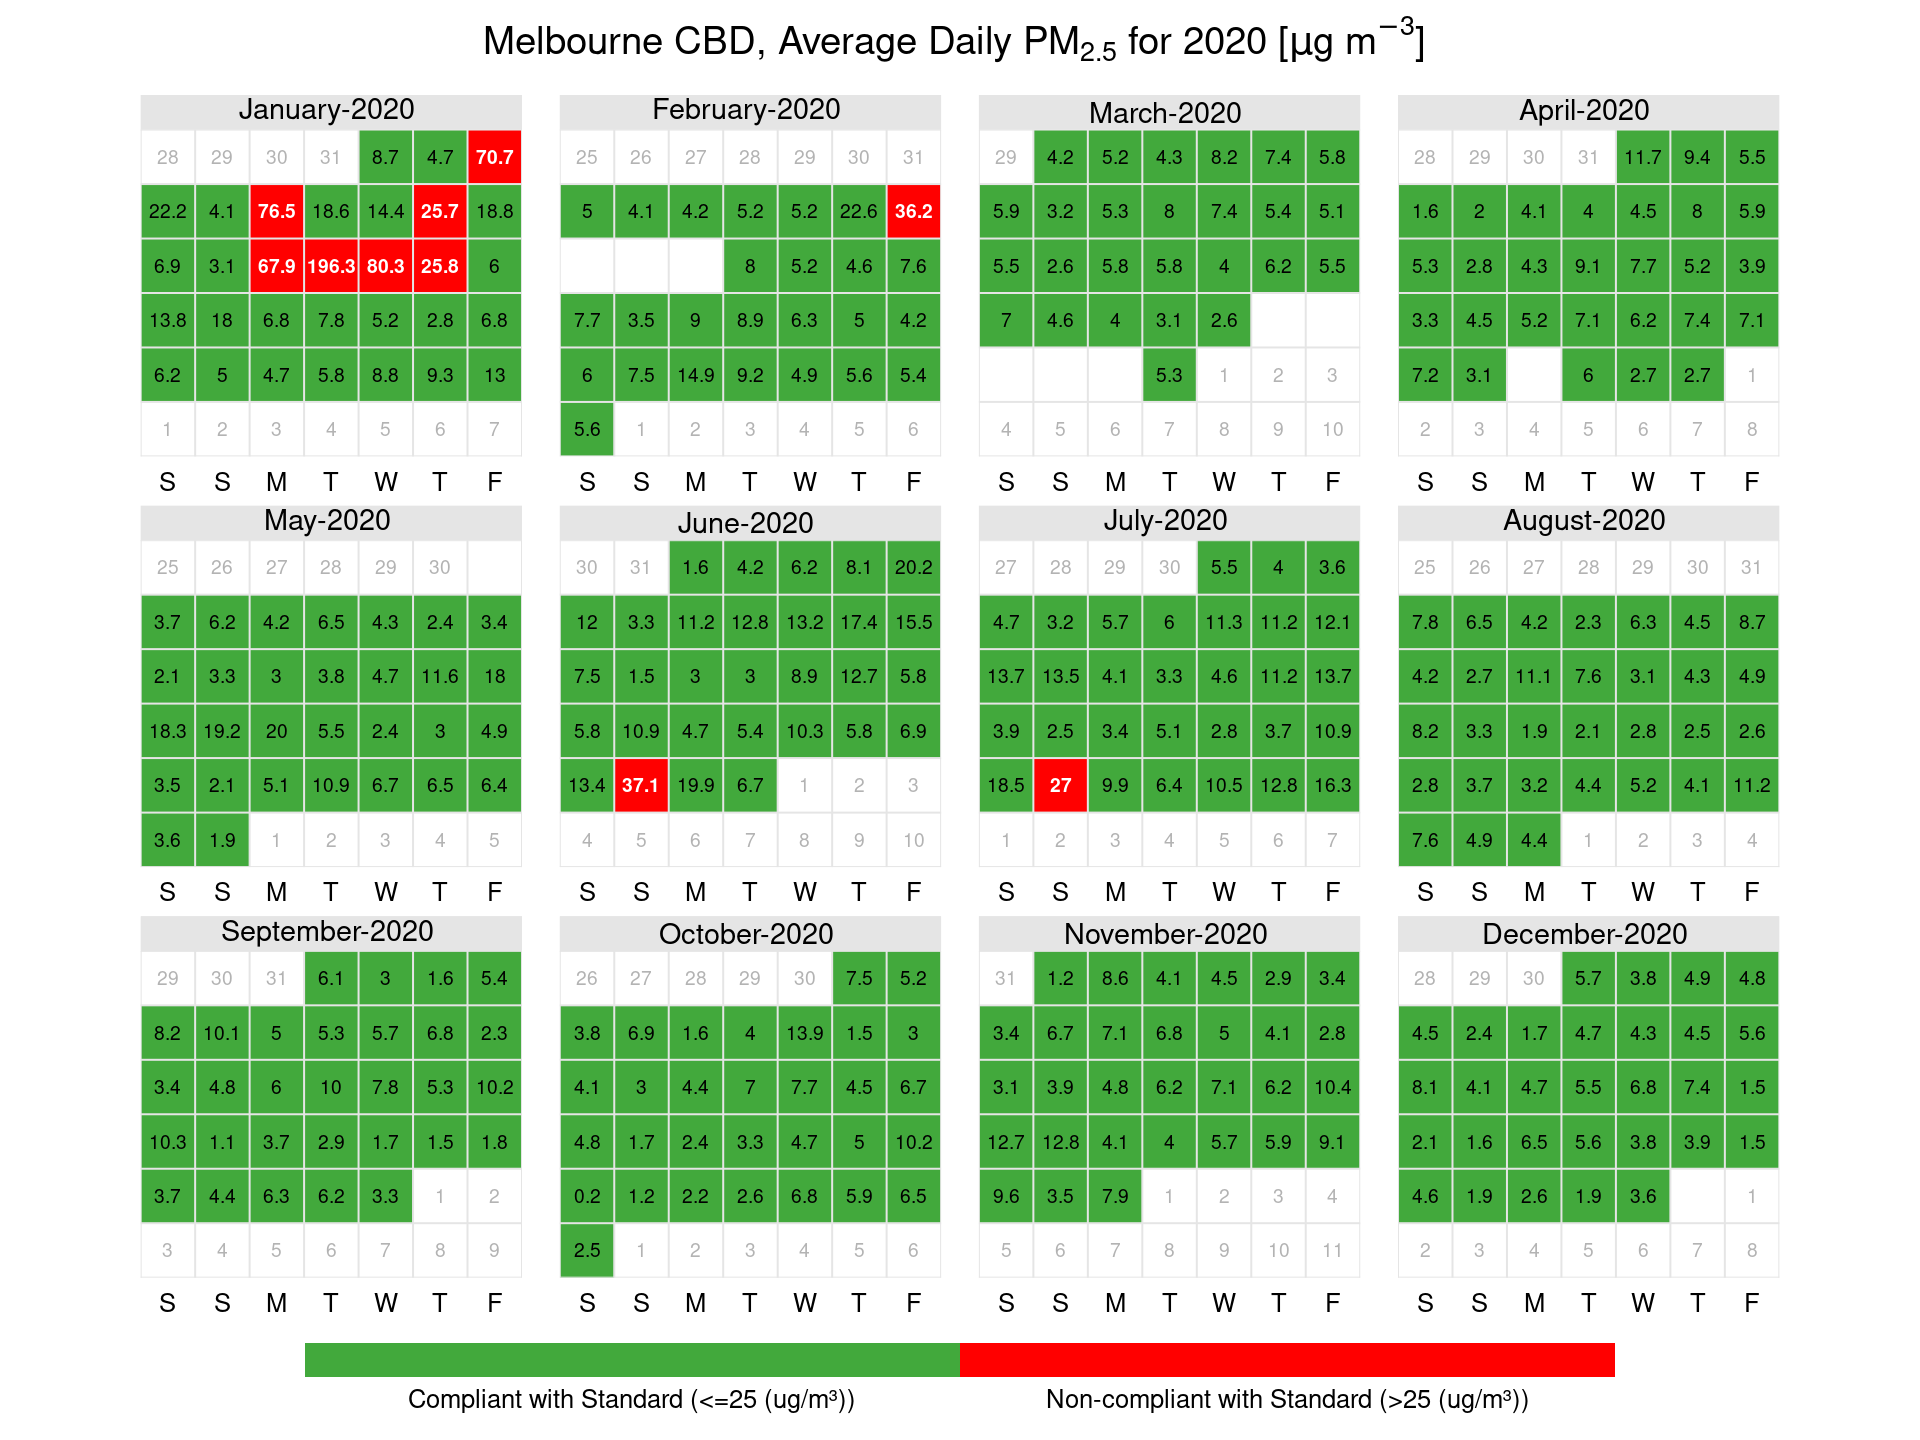
Figure 7: Traralgon PM2.5 calendar plots showing days where exceedances of the average daily PM2.5 standard occurred in µg/m3
3.2 Particles (PM10)
In 2020 the peak 24-hour PM10 measurement at a NEPM station was 259.12 µg/m3 at Dandenong on 14 January 2020. Similar concentrations were also recorded at other Melbourne stations, however due to a sensor fault at Footscray, an exceedance was not recorded on this day. As shown in Figures 8 to 13, there were exceedances of the 24-hour standard recorded during the year. All but one exceedance of the standard for PM10 in 2020 occurred during January and February and were associated with the major bushfires that impacted the south east coast of Australia. One exceedance of the standard at Footscray in November 2020 was attributed to local dust sources.
Bushfires and continental scale dust storms are classified as exceptional events as per the definition in the Measure. In 2020 no exceedances were attributed to continental-scale dust storms.
Table 20: 24-hour PM10 percentiles for 2020
| (% days) | Max | 99th | 98th | 95th | 90th | 75th | 50th | |
|---|---|---|---|---|---|---|---|---|
| Alphington | 92.35 | 226.48 | 68.99 | 48.01 | 37.08 | 28.96 | 21.98 | 16.22 |
| Dandenong | 91.26 | 259.12 | 87.27 | 62.22 | 37.08 | 29.81 | 23.21 | 17.57 |
| Footscray | 87.43 | 50.95 | 36.12 | 35.46 | 31.24 | 25.93 | 20.96 | 15.45 |
| Geelong South | 69.4 | 199.41 | 143.66 | 61.38 | 40.11 | 32.17 | 25.35 | 17.96 |
| Mooroolbark | 89.07 | 76.06 | 51 | 38.43 | 31.01 | 23.41 | 18.4 | 13.91 |
| Traralgon | 90.71 | 236.31 | 156.55 | 62.43 | 32.88 | 27.07 | 22.7 | 17.22 |
Figure 8: Alphington PM10 calendar plots showing days where exceedances of the average daily PM10 standard occurred in µg/m3
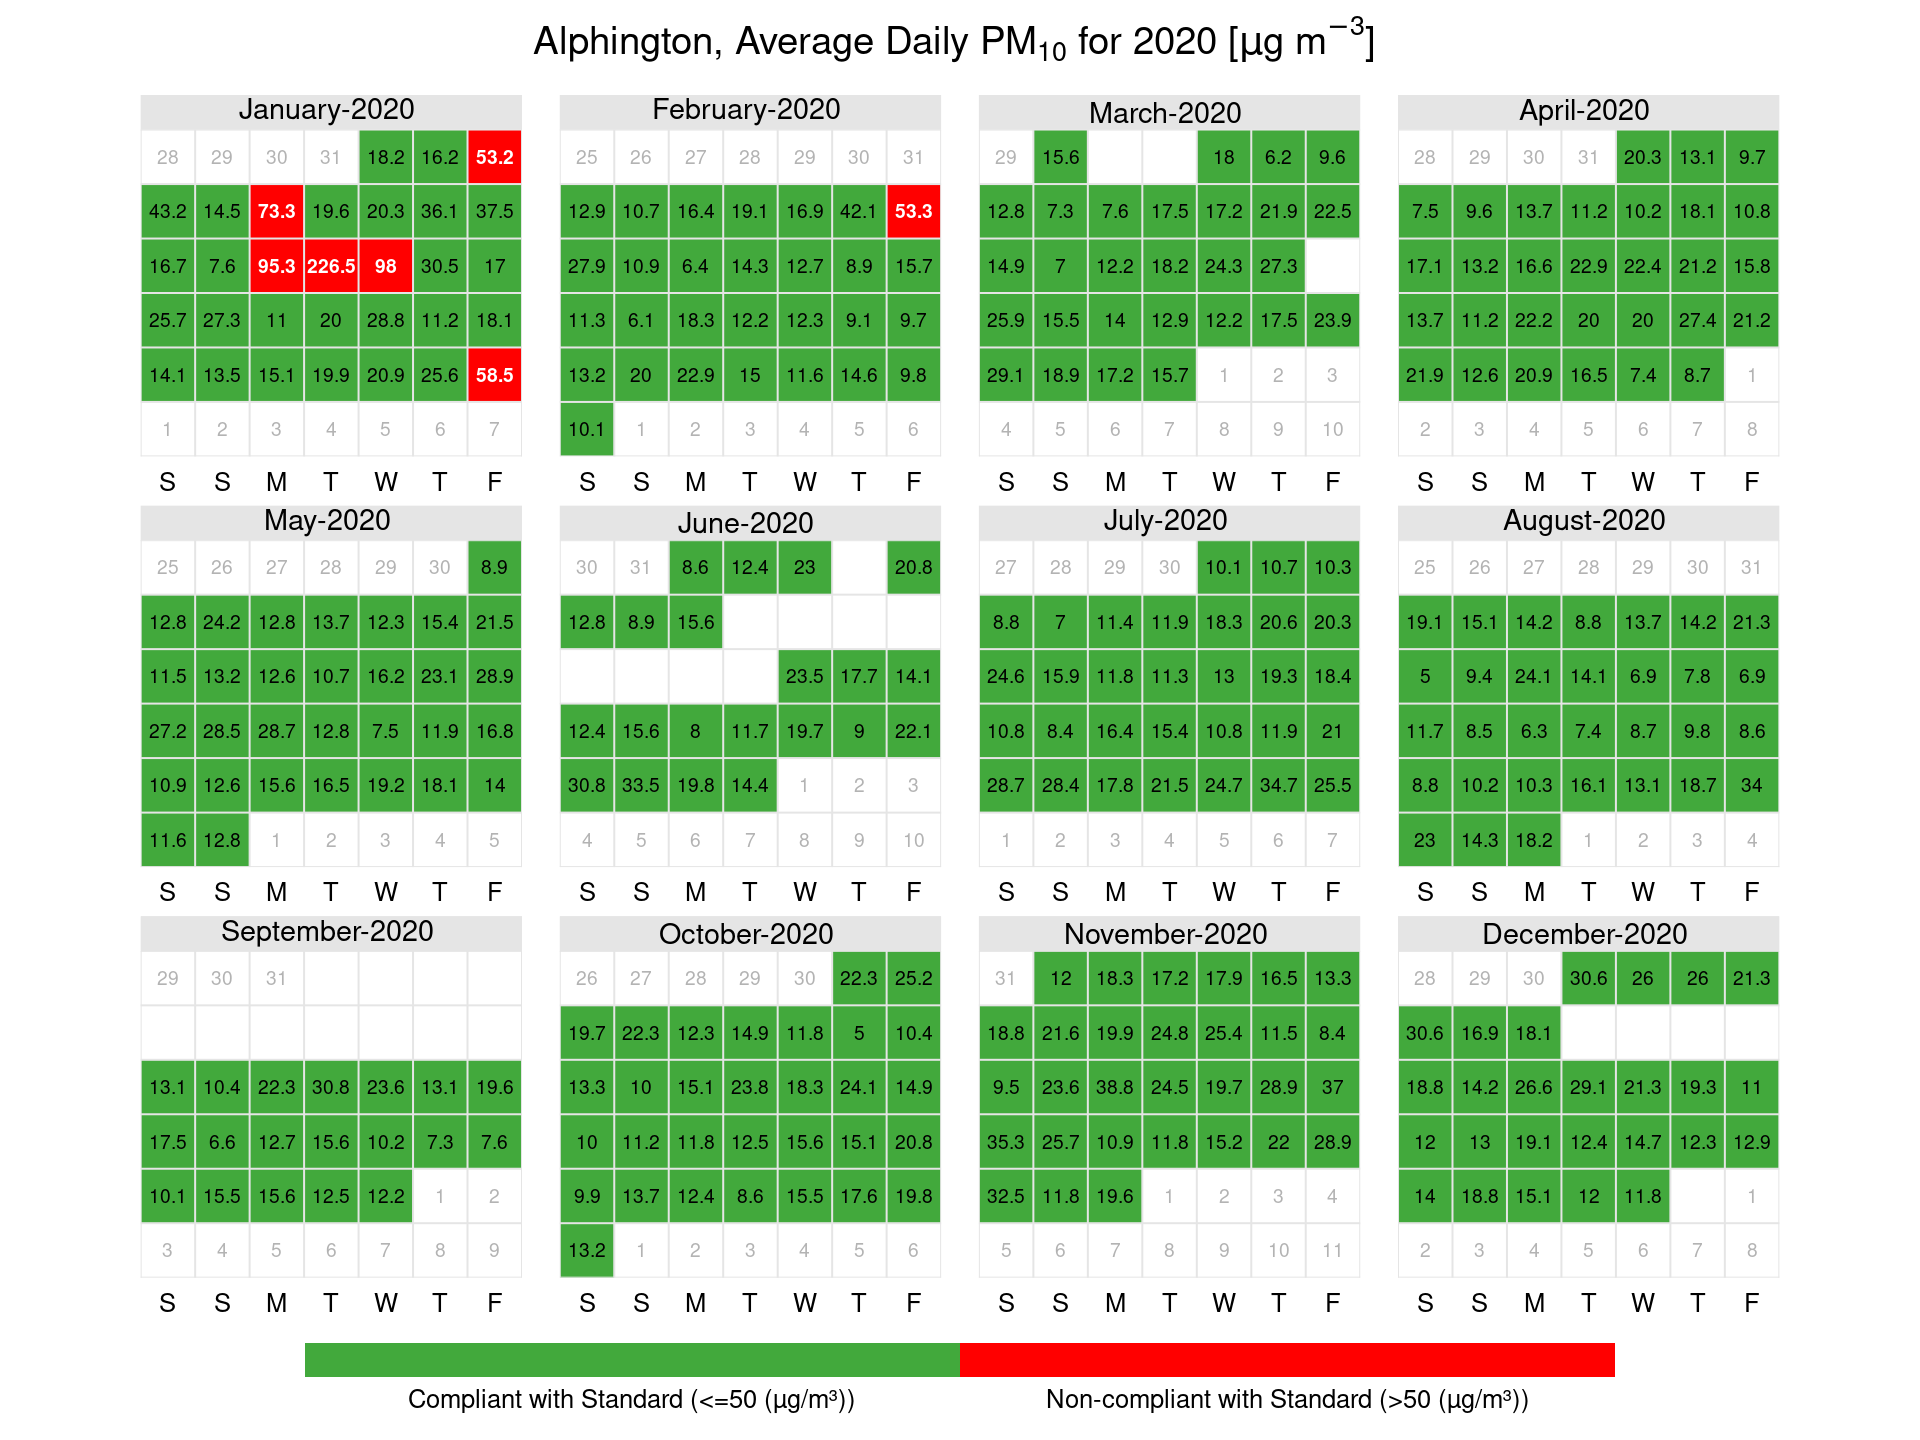
Figure 9: Dandenong PM10 calendar plots showing days where exceedances of the average daily PM10 standard occurred in µg/m3
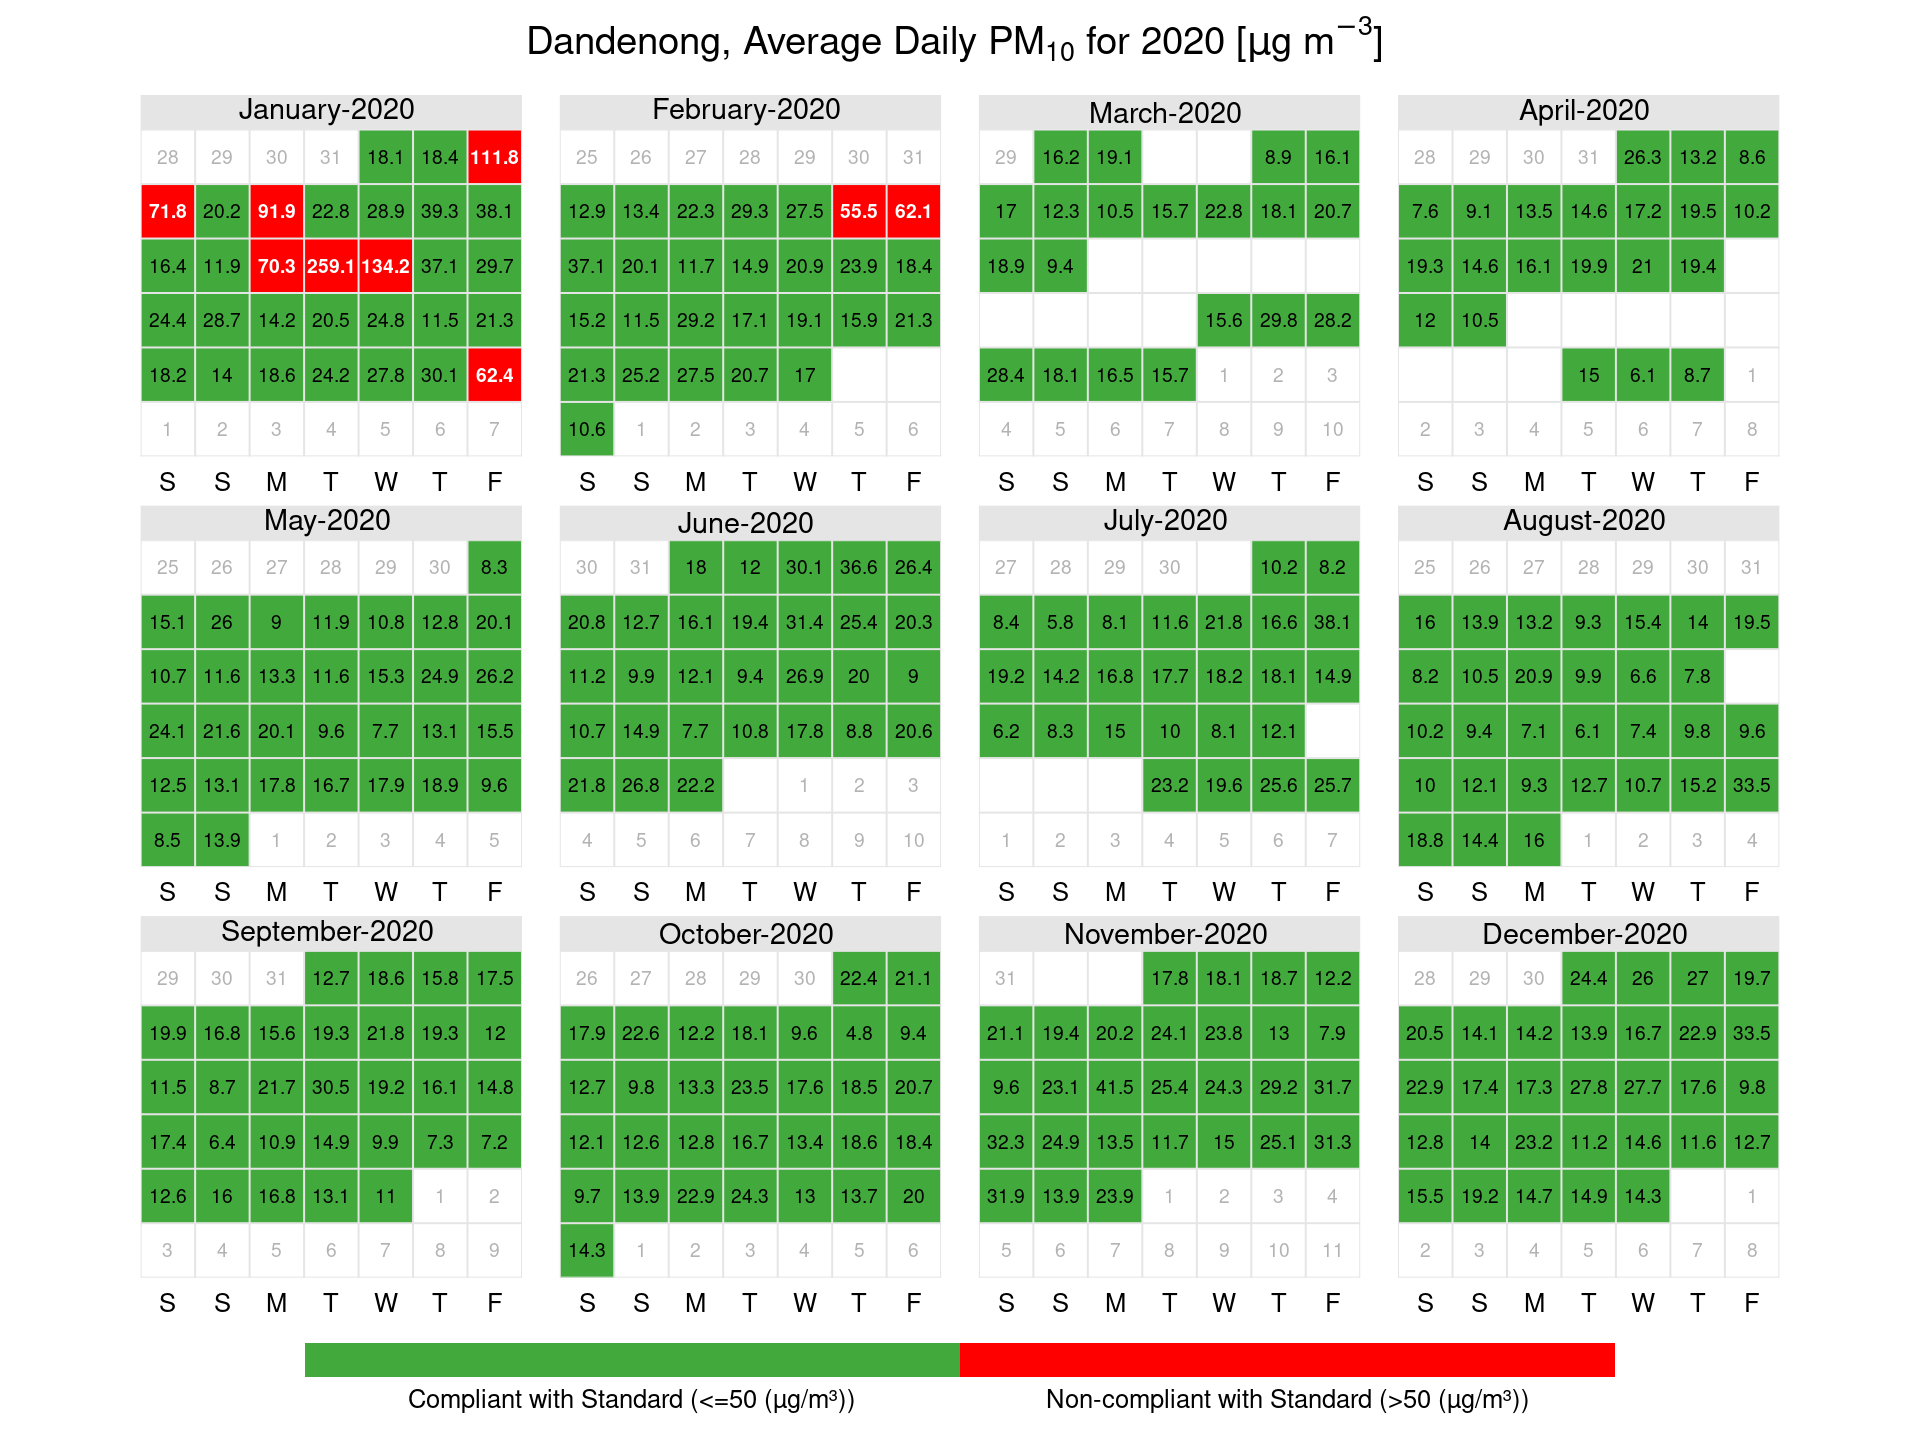
Figure 10: Footscray PM10 calendar plots showing days where exceedances of the average daily PM10 standard occurred in µg/m3
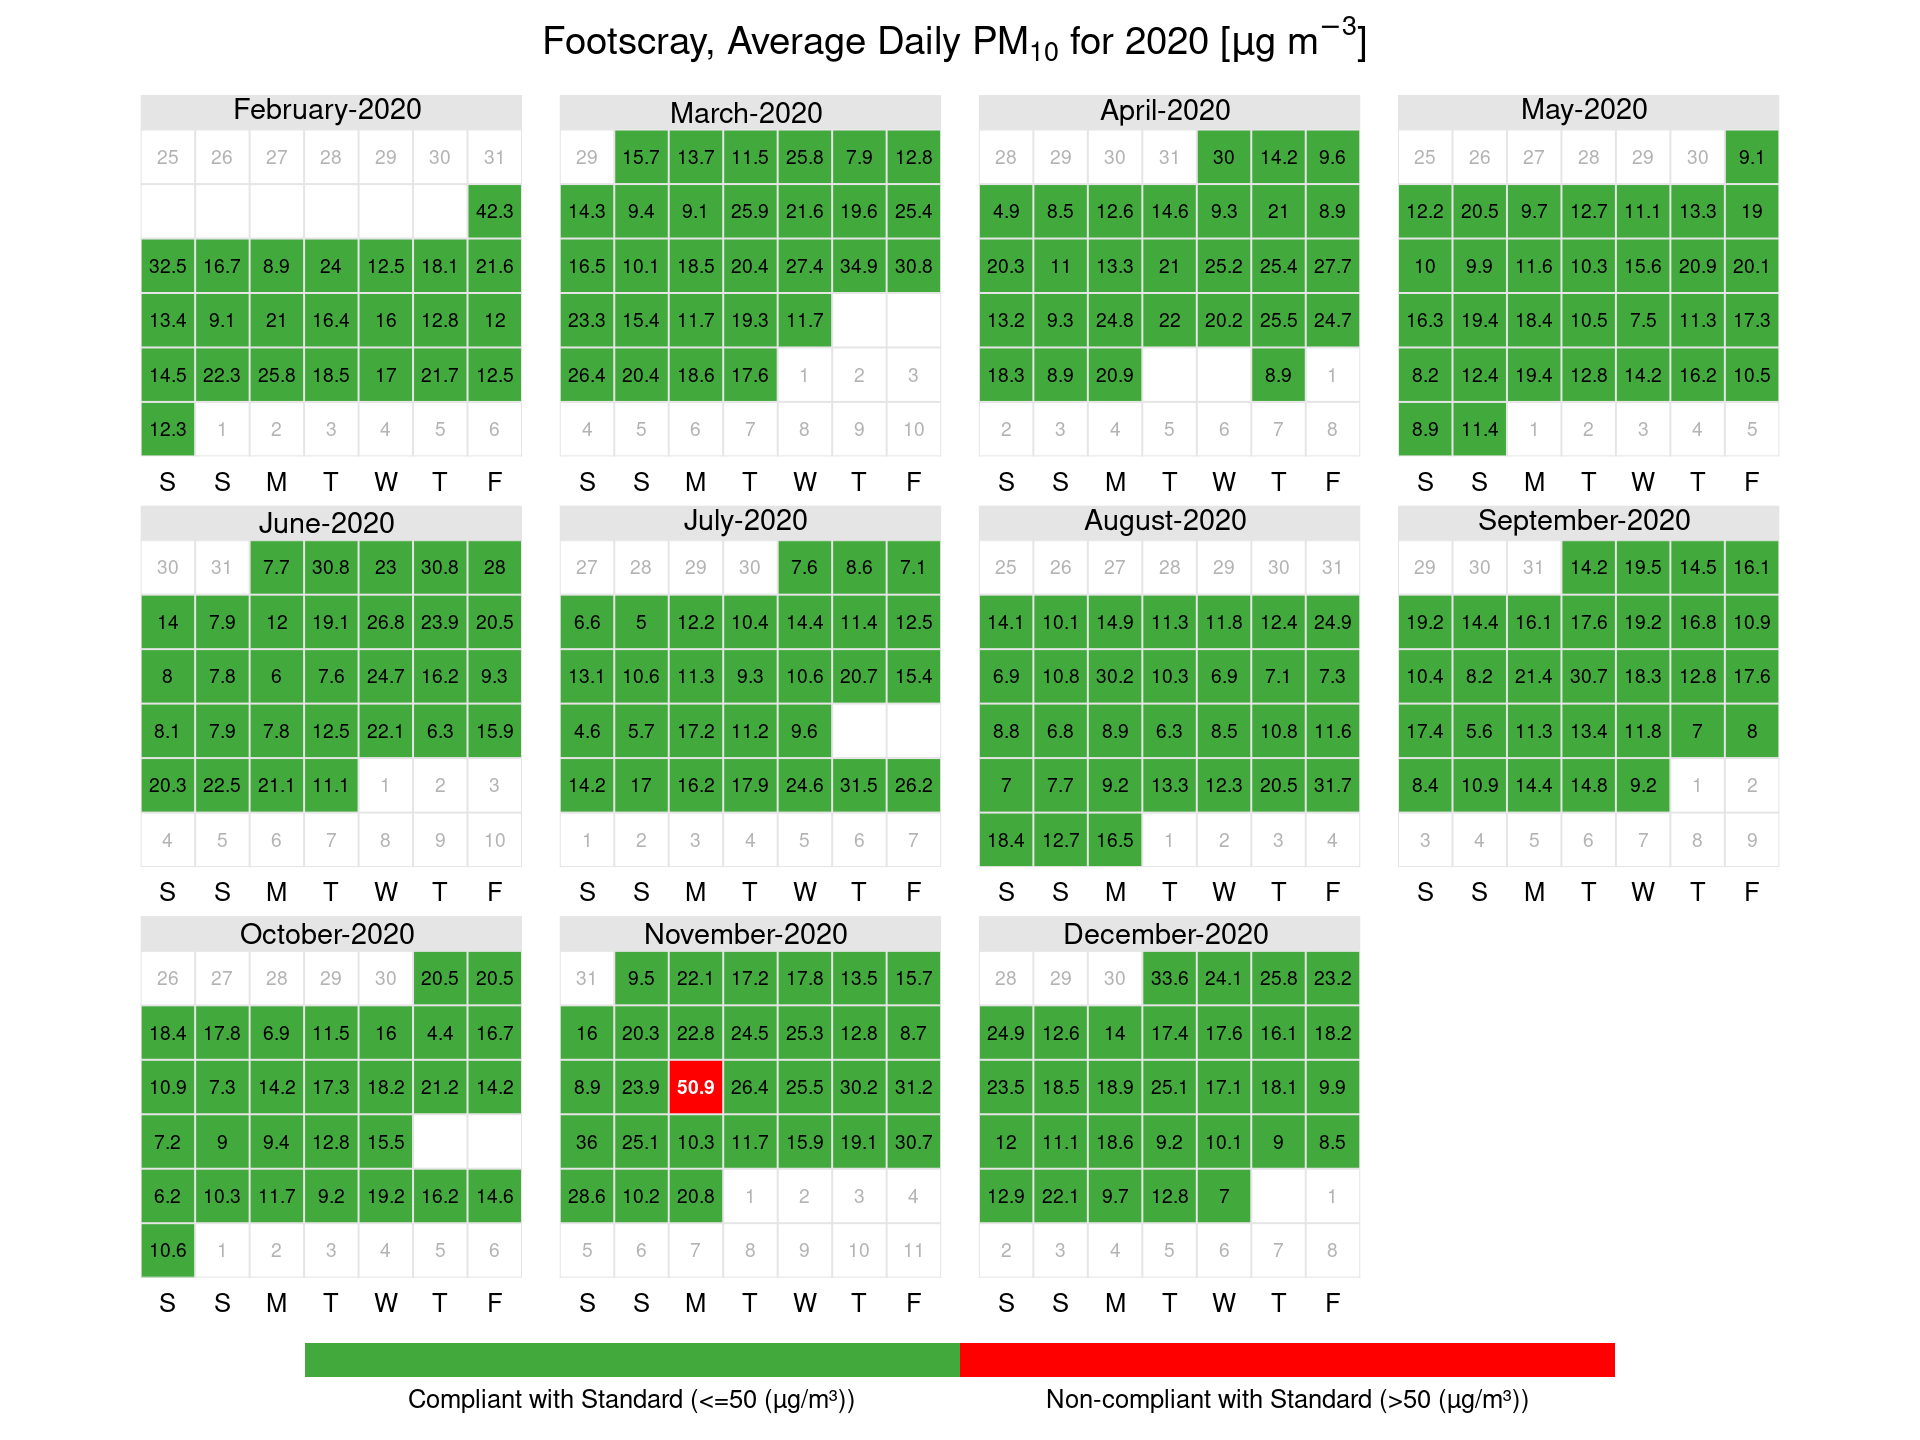
Figure 11: Geelong South PM10 calendar plots showing days where exceedances of the average daily PM10 standard occurred in µg/m3
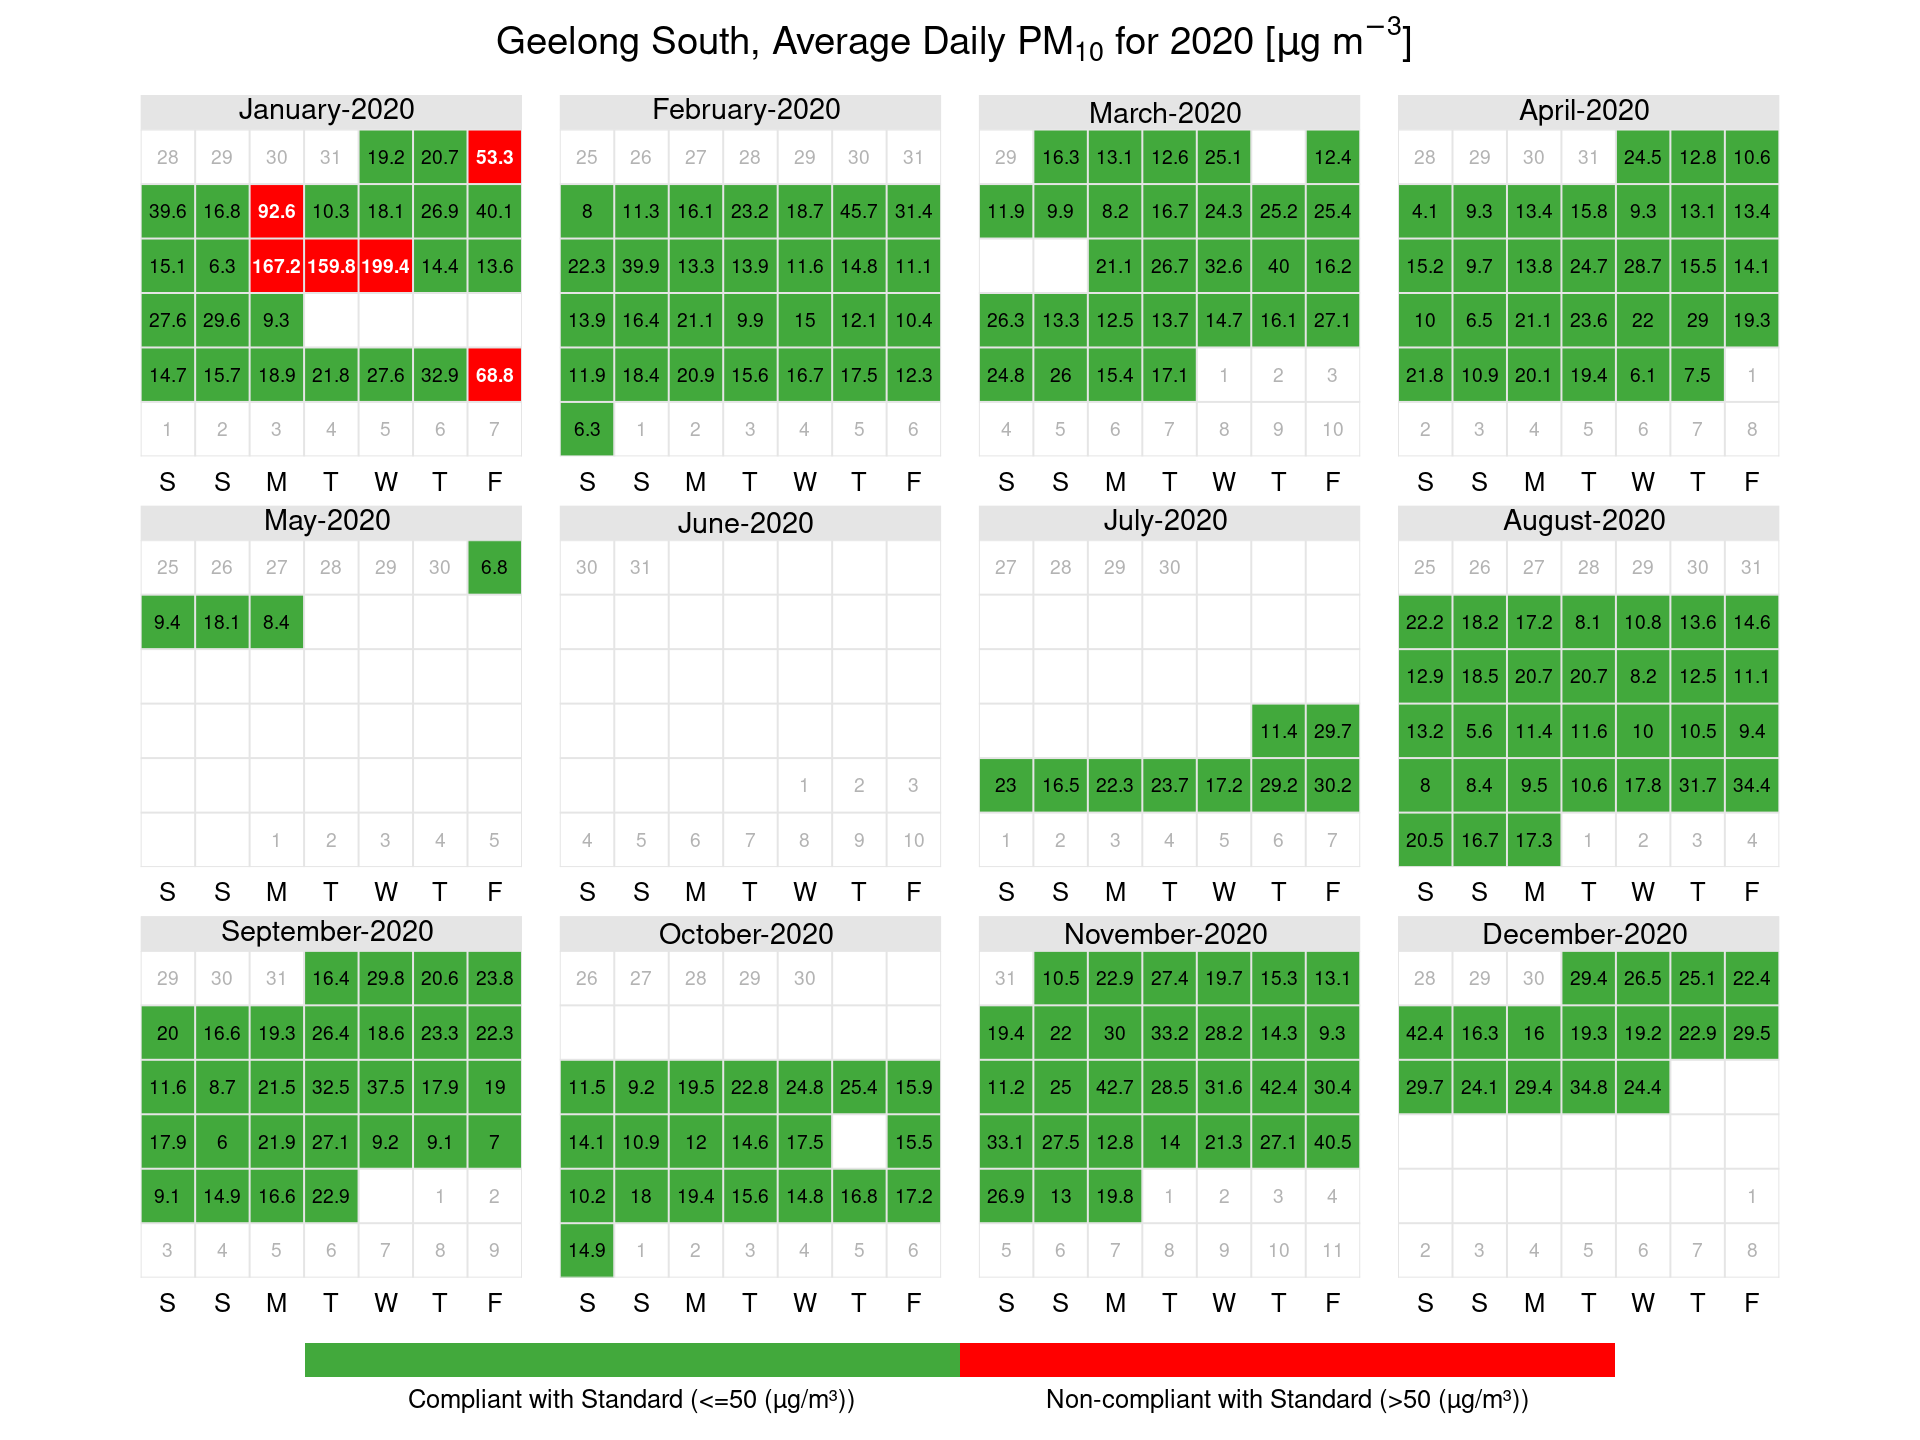
Figure 12: Mooroolbark PM10 calendar plots showing days where exceedances of the average daily PM10 standard occurred in µg/m3
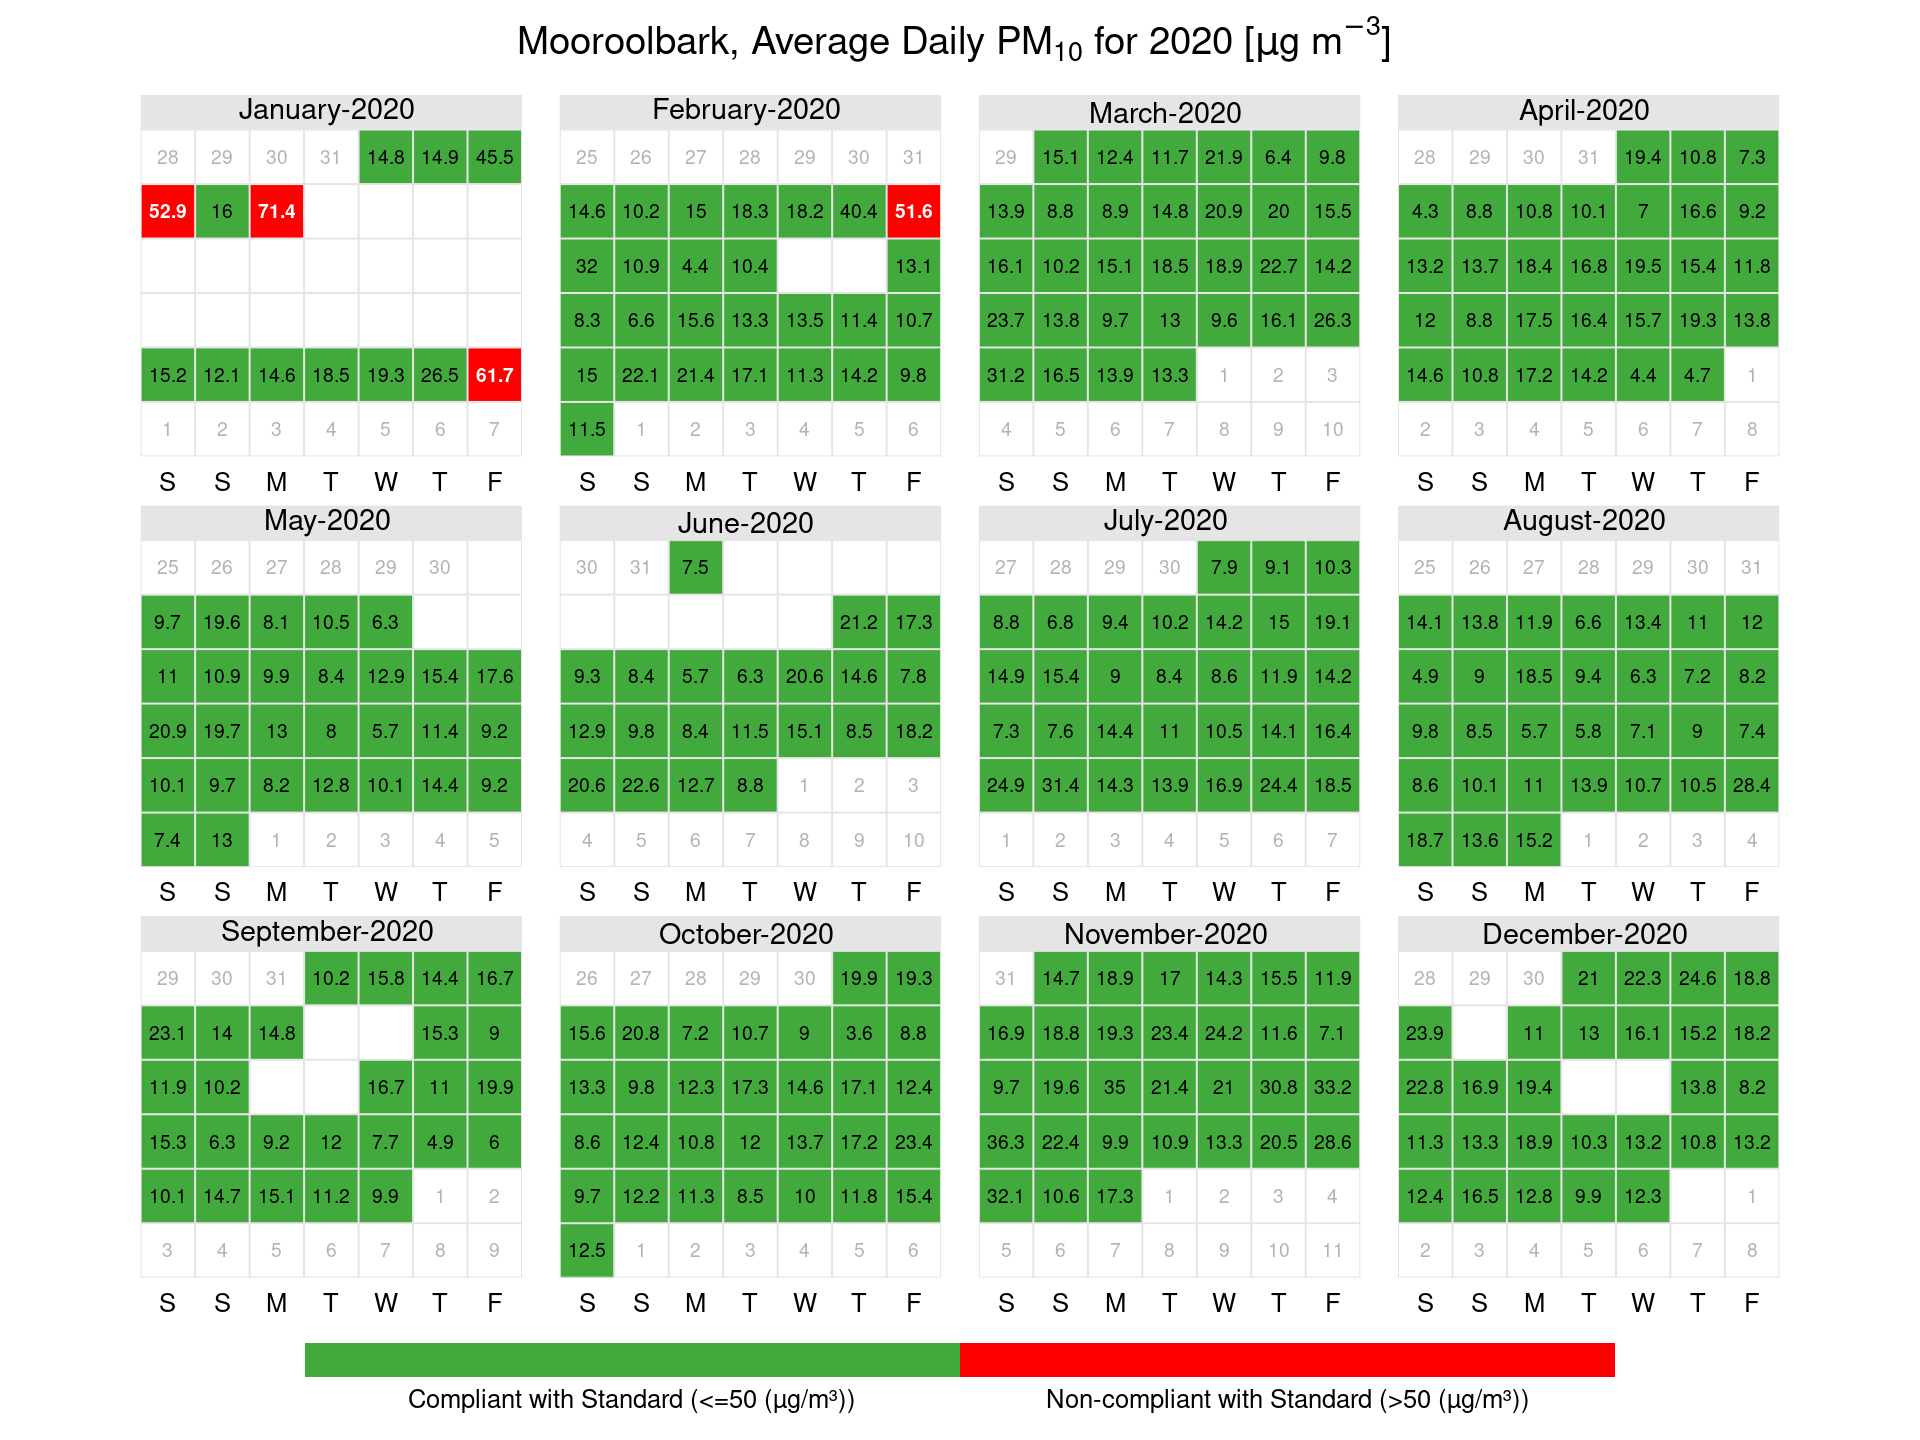
Figure 13: Traralgon PM10 calendar plots showing days where exceedances of the average daily PM10 standard occurred in µg/m3
3.3 Carbon monoxide (CO)
Percentiles of 2020 daily peak concentrations (over an eight-hour averaging period) are provided for carbon monoxide for each station in Table 21. Daily peak values are formed only when at least 75 per cent of the data for the day are valid. The percentiles for eight-hour carbon monoxide is based on rolling averages, including those that overlap from one day to the next.
Higher than usual maximum concentrations of carbon monoxide were recorded in 2020, this is likely to be due to significant bushfires that occurred in January. No exceedances of the standard were recorded in 2020.
Table 21: 8-hour carbon monoxide percentiles
| (% days) | Max | 99th | 98th | 95th | 90th | 75th | 50th | |
|---|---|---|---|---|---|---|---|---|
| Alphington | 88.52 | 2.25 | 1.35 | 1.21 | 0.99 | 0.74 | 0.41 | 0.22 |
| Footscray | 92.62 | 2.84 | 1.3 | 1.19 | 0.68 | 0.49 | 0.29 | 0.2 |
| Geelong South | 87.98 | 3.04 | 1.55 | 0.87 | 0.62 | 0.47 | 0.26 | 0.19 |
| Traralgon | 87.16 | 4.94 | 2.59 | 1.24 | 0.87 | 0.69 | 0.49 | 0.22 |
3.4 Nitrogen dioxide (NO2)
Percentiles of 2020 daily peak concentrations (over an one-hour averaging period) are provided for nitrogen dioxide for each station in Table 22. Daily peak values are formed only when at least 75 per cent of the data for the day are valid.
There were no exceedances of the nitrogen dioxide standard recorded in 2020.
Table 22: One-hour nitrogen dioxide percentiles
| (% days) | Max | 99th | 98th | 95th | 90th | 75th | 50th | |
|---|---|---|---|---|---|---|---|---|
| Alphington | 95.08 | 51.5 | 34.76 | 32.54 | 31.46 | 29.1 | 23.52 | 17.1 |
| Footscray | 97.81 | 64.8 | 39.53 | 37.84 | 35.23 | 32.43 | 26.67 | 19.2 |
| Geelong South | 93.44 | 52.8 | 41.79 | 35.12 | 28.4 | 25.99 | 21.17 | 13.85 |
| Traralgon | 92.9 | 32 | 27.86 | 26.84 | 25.01 | 22.9 | 18.45 | 12.65 |
3.5 Ozone (O3)
Percentiles of 2020 daily peak concentrations (over an one-hour and four-hour averaging periods) are provided for ozone for each station and standard in Tables 23 and Table 24. Daily peak values are formed only when at least 75 per cent of the data for the day are valid. The percentiles for four-hour ozone is based on rolling averages, including those that overlap from one day to the next.
In 2020 there were several exceedances of the ozone standard recorded in January 2020. These were associated with the major bushfires which impacted south east Australia.
Table 23: One-hour ozone percentiles
| (% days) | Max | 99th | 98th | 95th | 90th | 75th | 50th | |
|---|---|---|---|---|---|---|---|---|
| Alphington | 94.81 | 129.2 | 74.13 | 65.4 | 47.24 | 37.76 | 30.75 | 25.9 |
| Dandenong | 98.09 | 110.9 | 74.79 | 55.29 | 43.11 | 36.74 | 30.5 | 26.4 |
| Footscray | 98.09 | 117.1 | 72.78 | 62.64 | 43.73 | 35.52 | 29.15 | 25.7 |
| Geelong South | 93.72 | 113.9 | 73.96 | 51.87 | 44.4 | 35 | 29.9 | 27.1 |
| Melton | 95.08 | 128.3 | 74.42 | 62.75 | 46.62 | 38.48 | 32.12 | 28.7 |
| Point Cook | 59.56 | 55.6 | 49.96 | 46.97 | 41.32 | 35.96 | 32.08 | 29.8 |
| Traralgon | 89.89 | 107.5 | 70.79 | 56.07 | 40.94 | 35.8 | 29.8 | 25.5 |
Table 24: 4-hour ozone percentiles
| (% days) | Max | 99th | 98th | 95th | 90th | 75th | 50th | |
|---|---|---|---|---|---|---|---|---|
| Alphington | 92.9 | 119.15 | 71.57 | 59.18 | 43.09 | 36.14 | 29.41 | 24.89 |
| Dandenong | 96.99 | 98 | 69.13 | 50.81 | 39.82 | 34.27 | 29.86 | 25.2 |
| Footscray | 96.45 | 108.38 | 68.98 | 57.61 | 40.14 | 34 | 28.27 | 24.27 |
| Geelong South | 93.44 | 95.5 | 63.42 | 48.29 | 40.6 | 33.67 | 28.95 | 25.89 |
| Melton | 93.99 | 119.35 | 67.63 | 60.43 | 43.69 | 36.67 | 31.61 | 27.86 |
| Point Cook | 59.29 | 50.55 | 46.3 | 43.44 | 38.78 | 34.58 | 31.38 | 29.02 |
| Traralgon | 88.52 | 101.55 | 62.56 | 50.8 | 38.43 | 33.08 | 28.44 | 24.36 |
Figure 14: Alphington ozone calendar plots showing days where exceedances of the maximum daily standard occurred in ppb
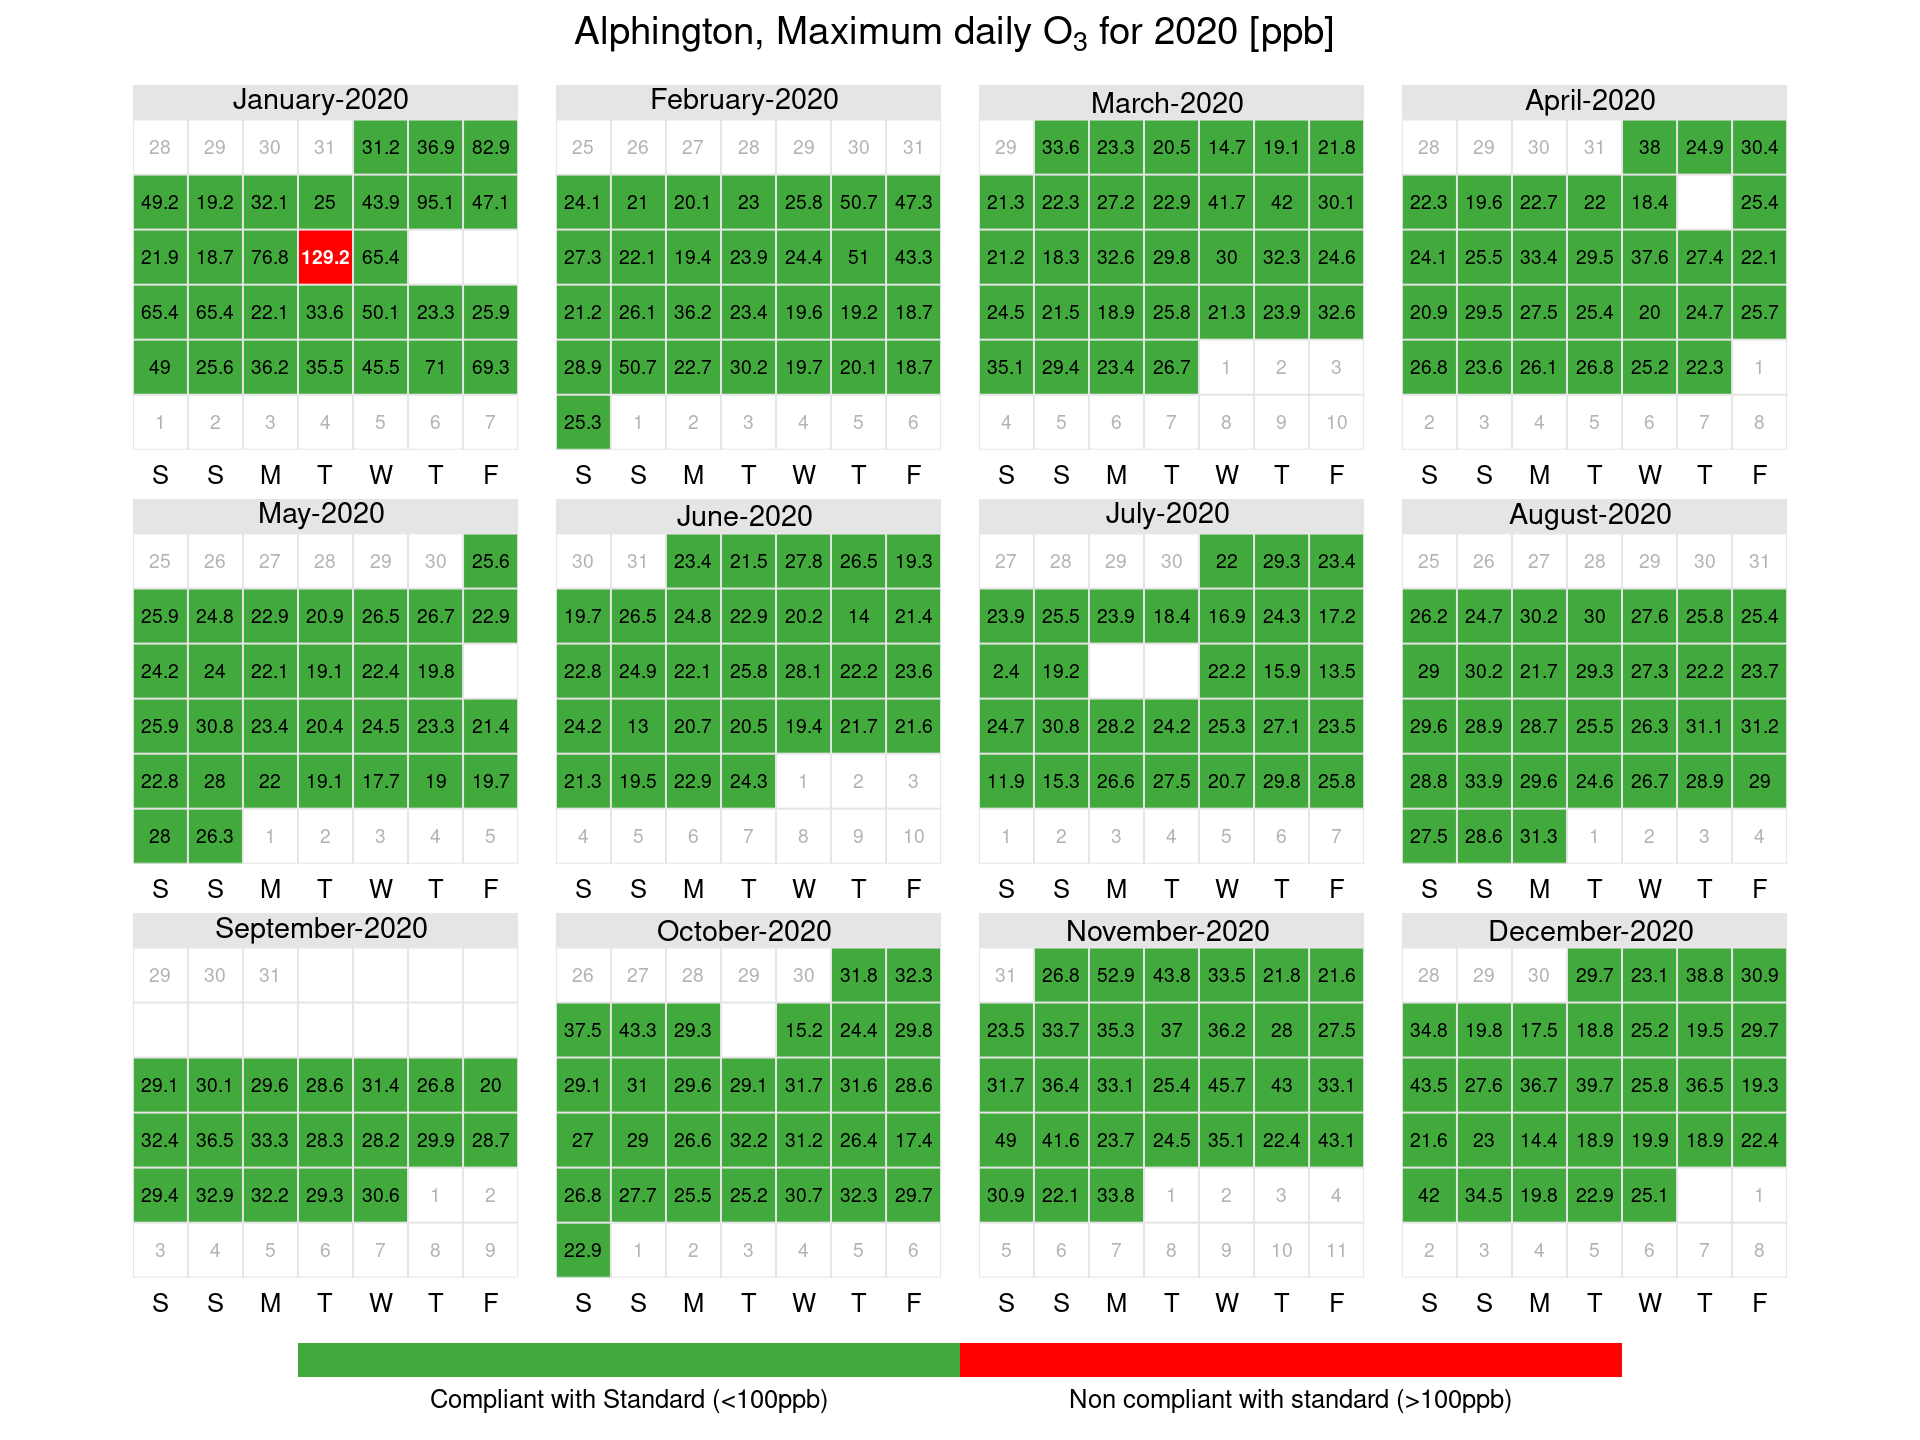
Figure 15: Alphington 4-hour ozone calendar plots showing days where exceedances of the maximum daily standard occurred in ppb
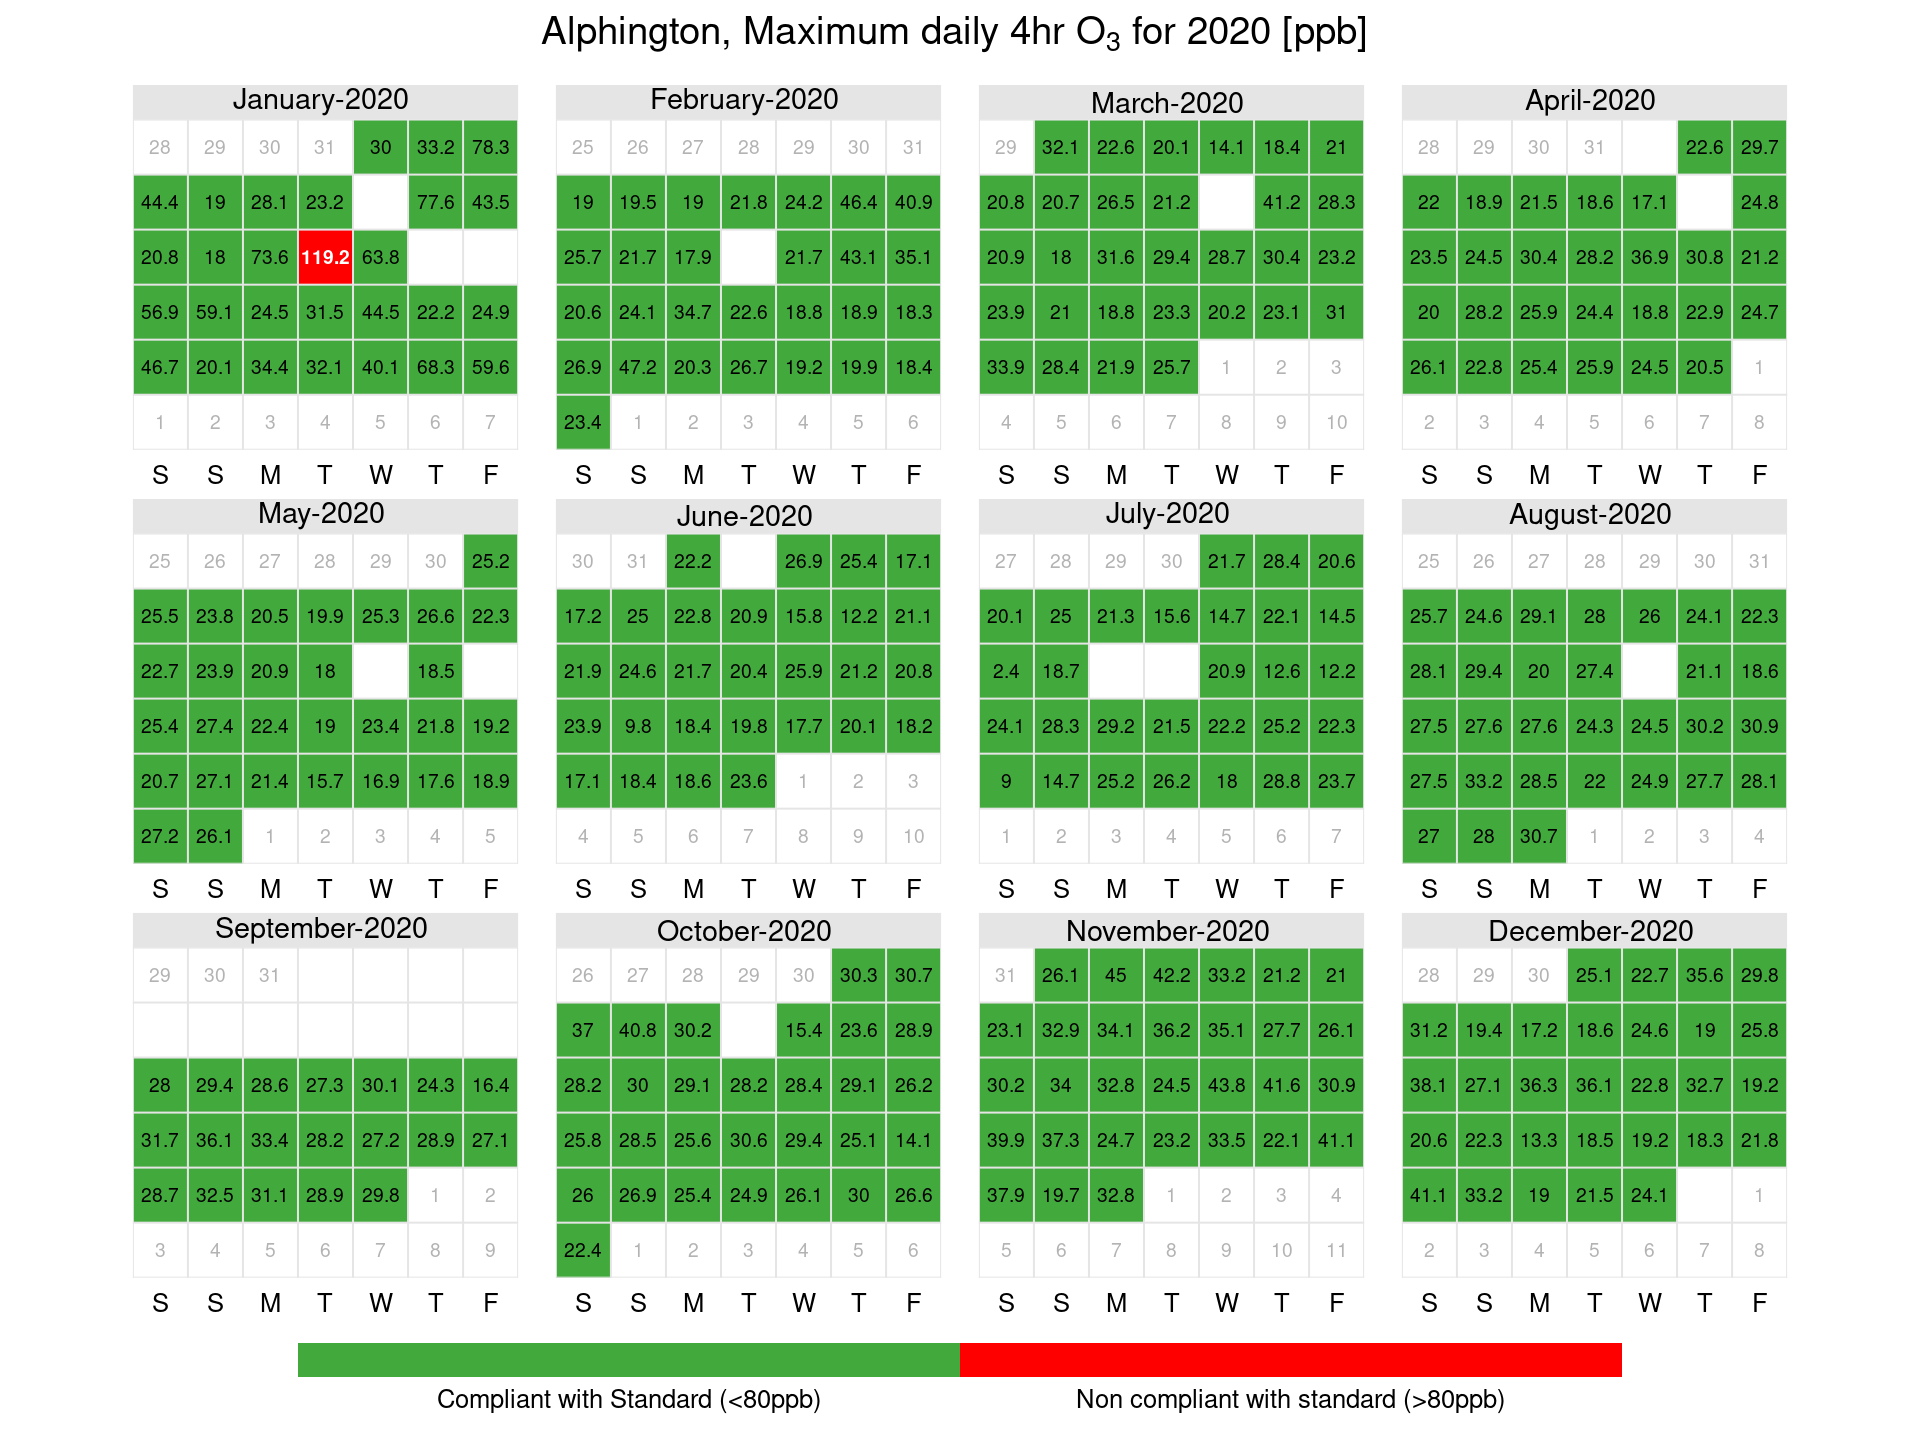
Figure 16: Dandenong ozone calendar plots showing days where exceedances of the maximum daily standard occurred in ppb
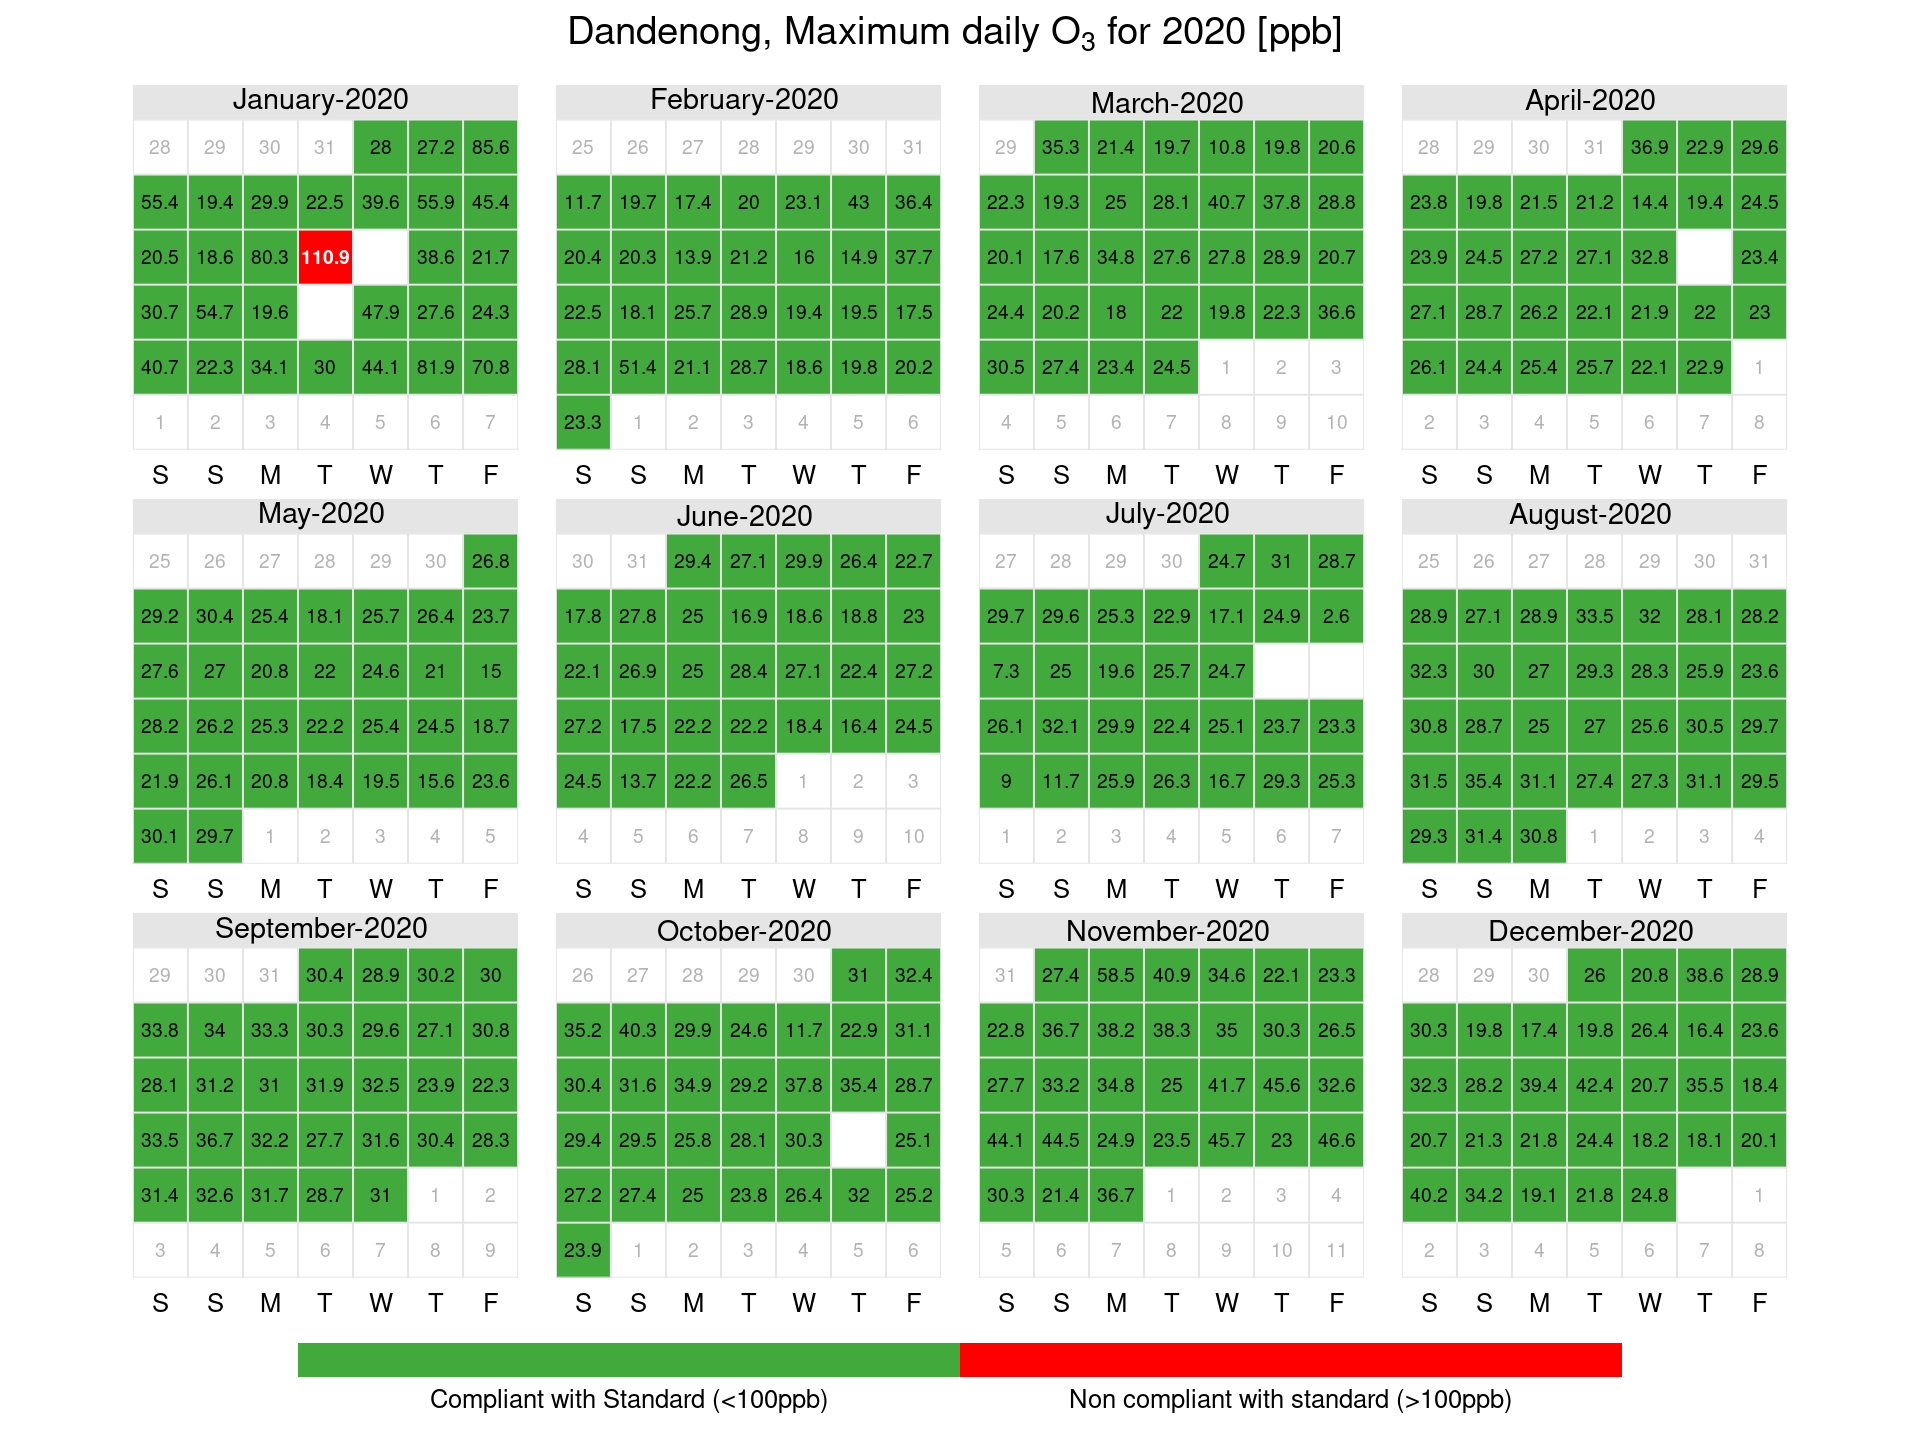
Figure 17: Dandenong 4-hour ozone calendar plots showing days where exceedances of the maximum daily standard occurred in ppb
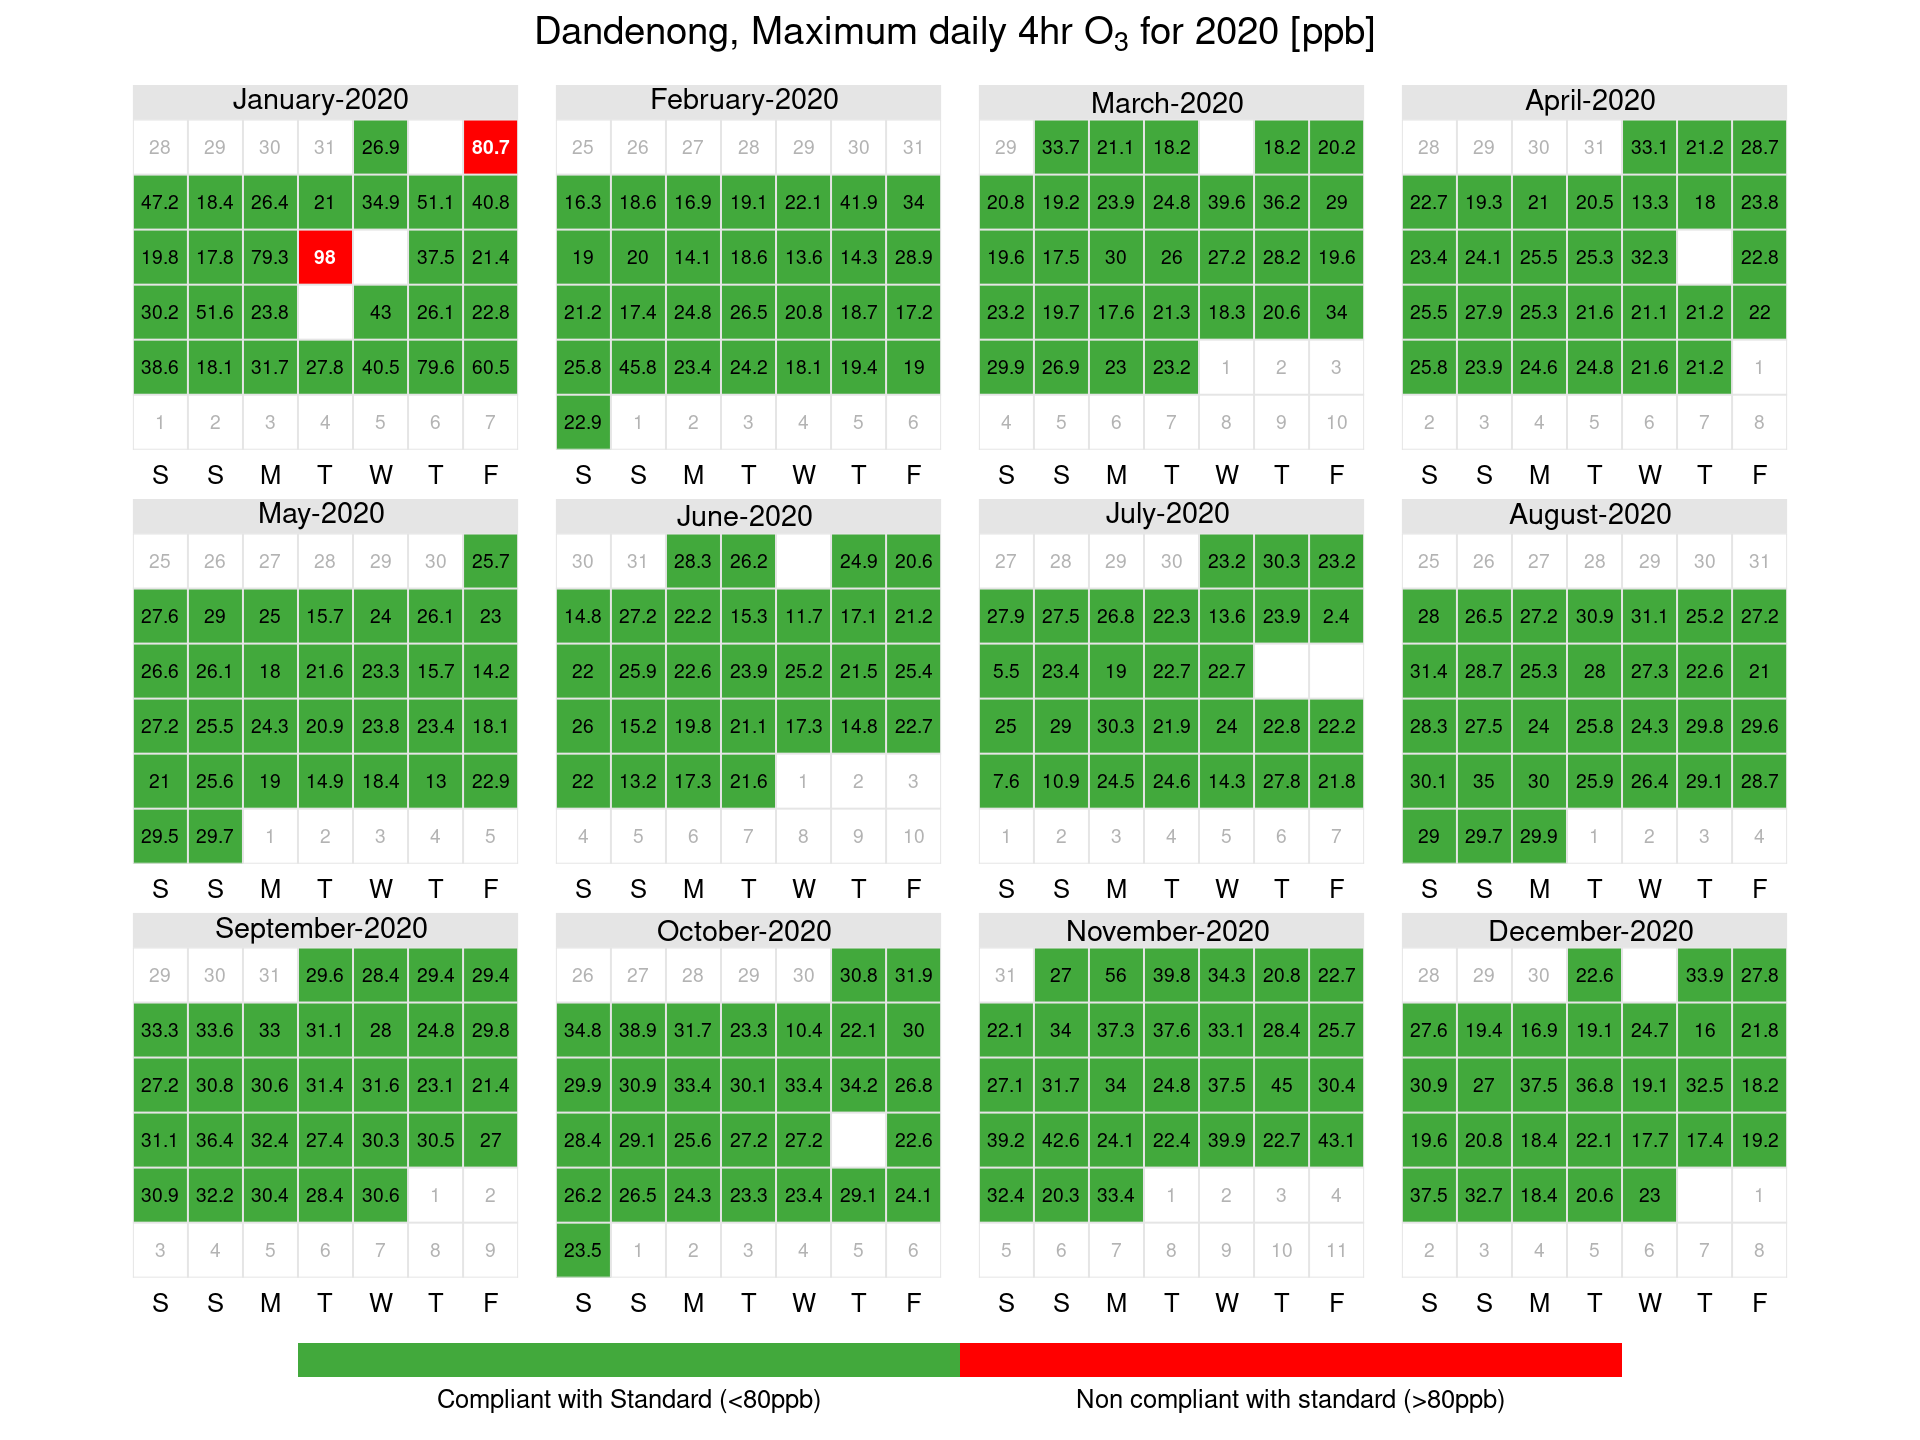
Figure 18: Footscray ozone calendar plots showing days where exceedances of the maximum daily standard occurred in ppb
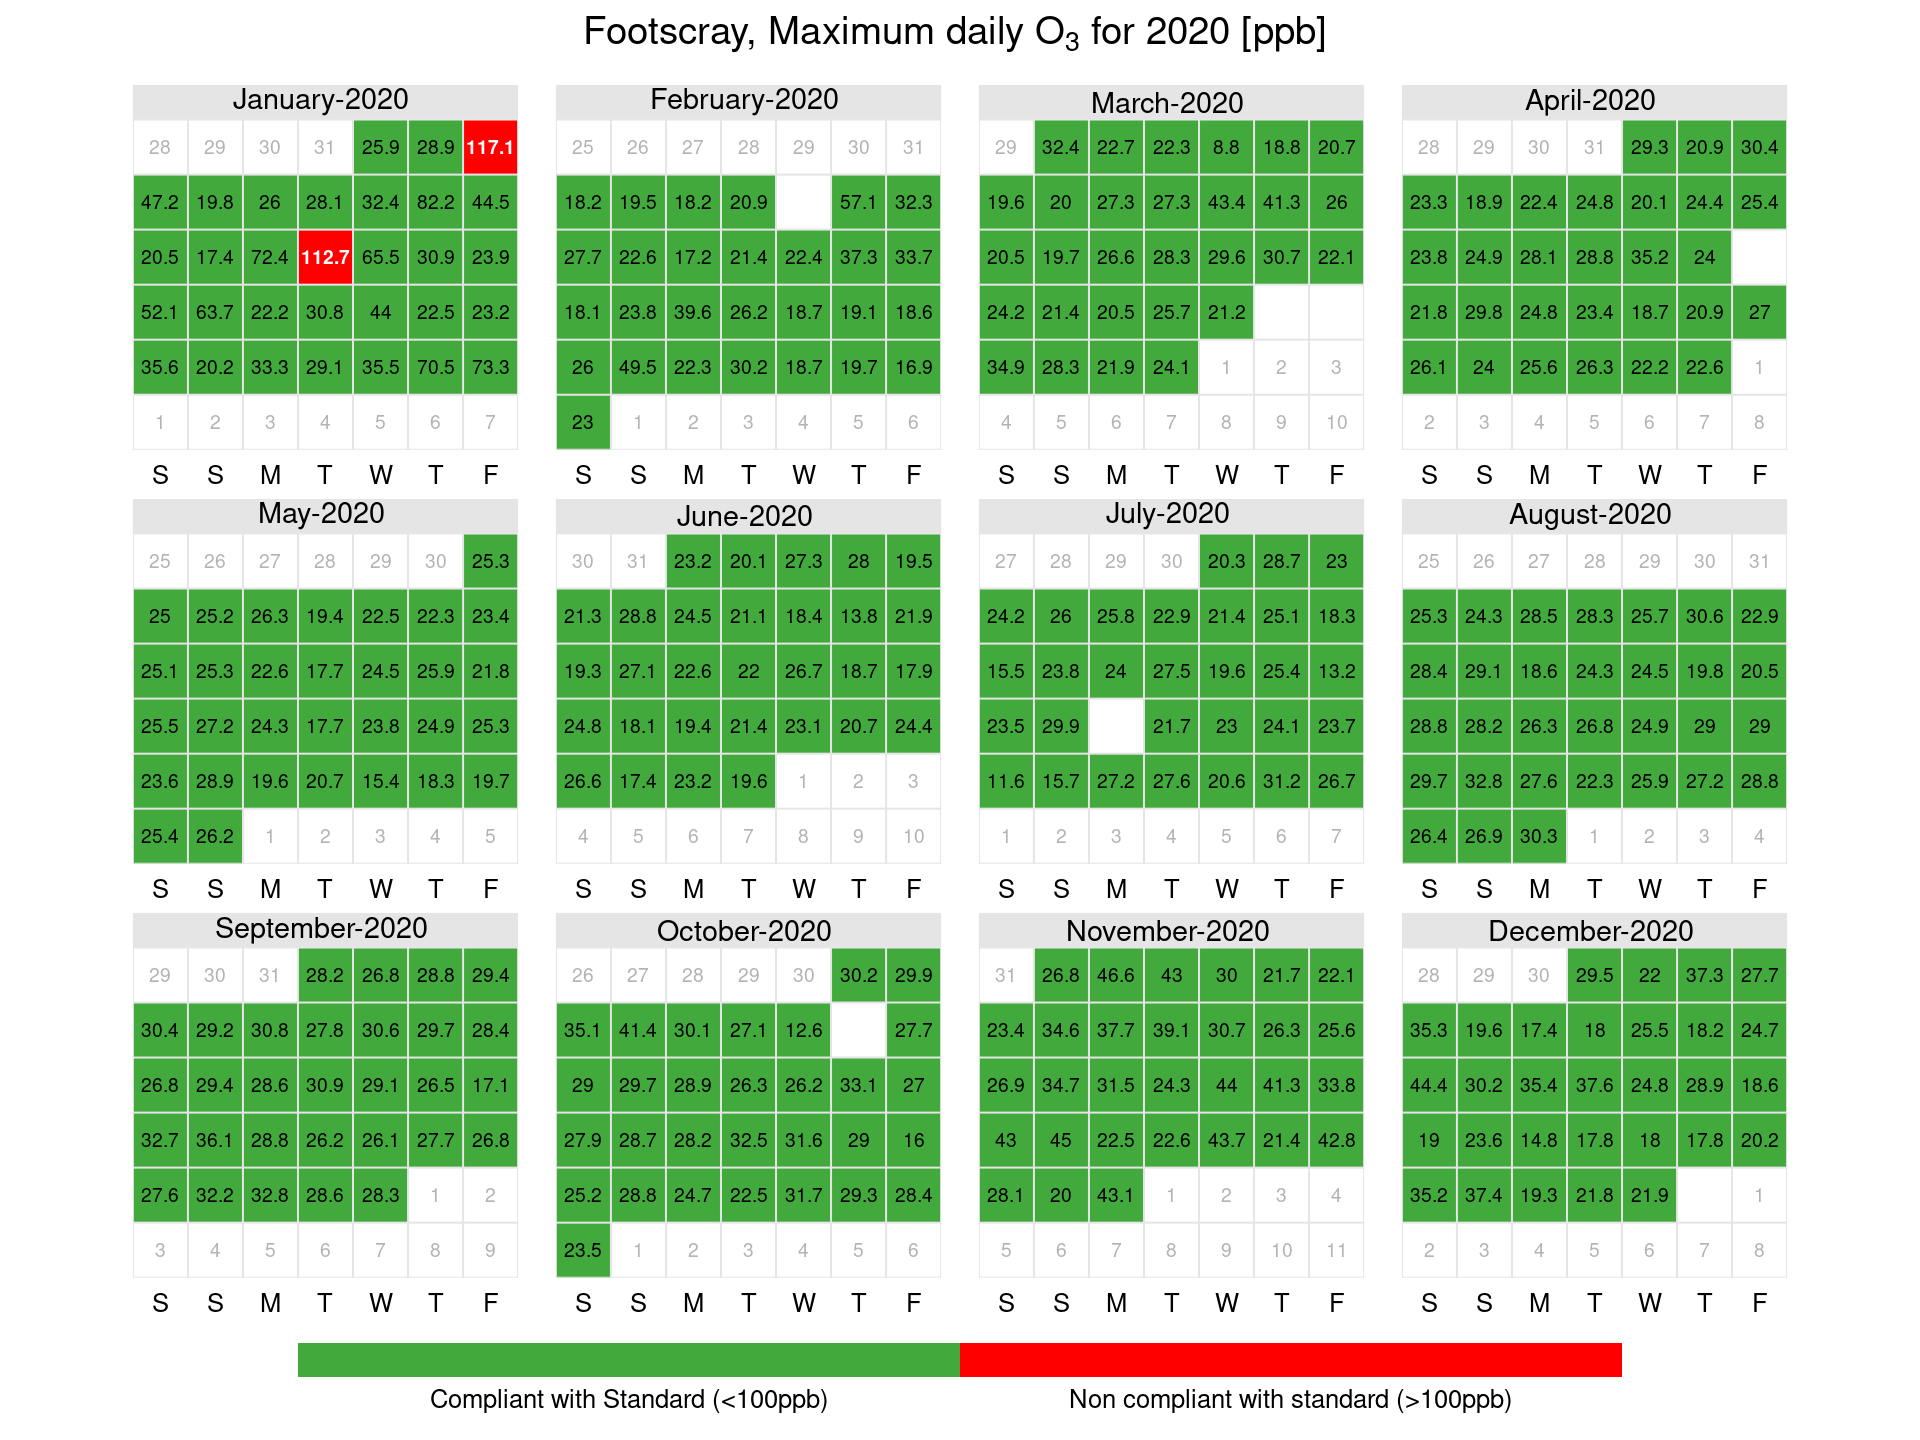
Figure 19: Footscray 4-hour ozone calendar plots showing days where exceedances of the maximum daily standard occurred in ppb
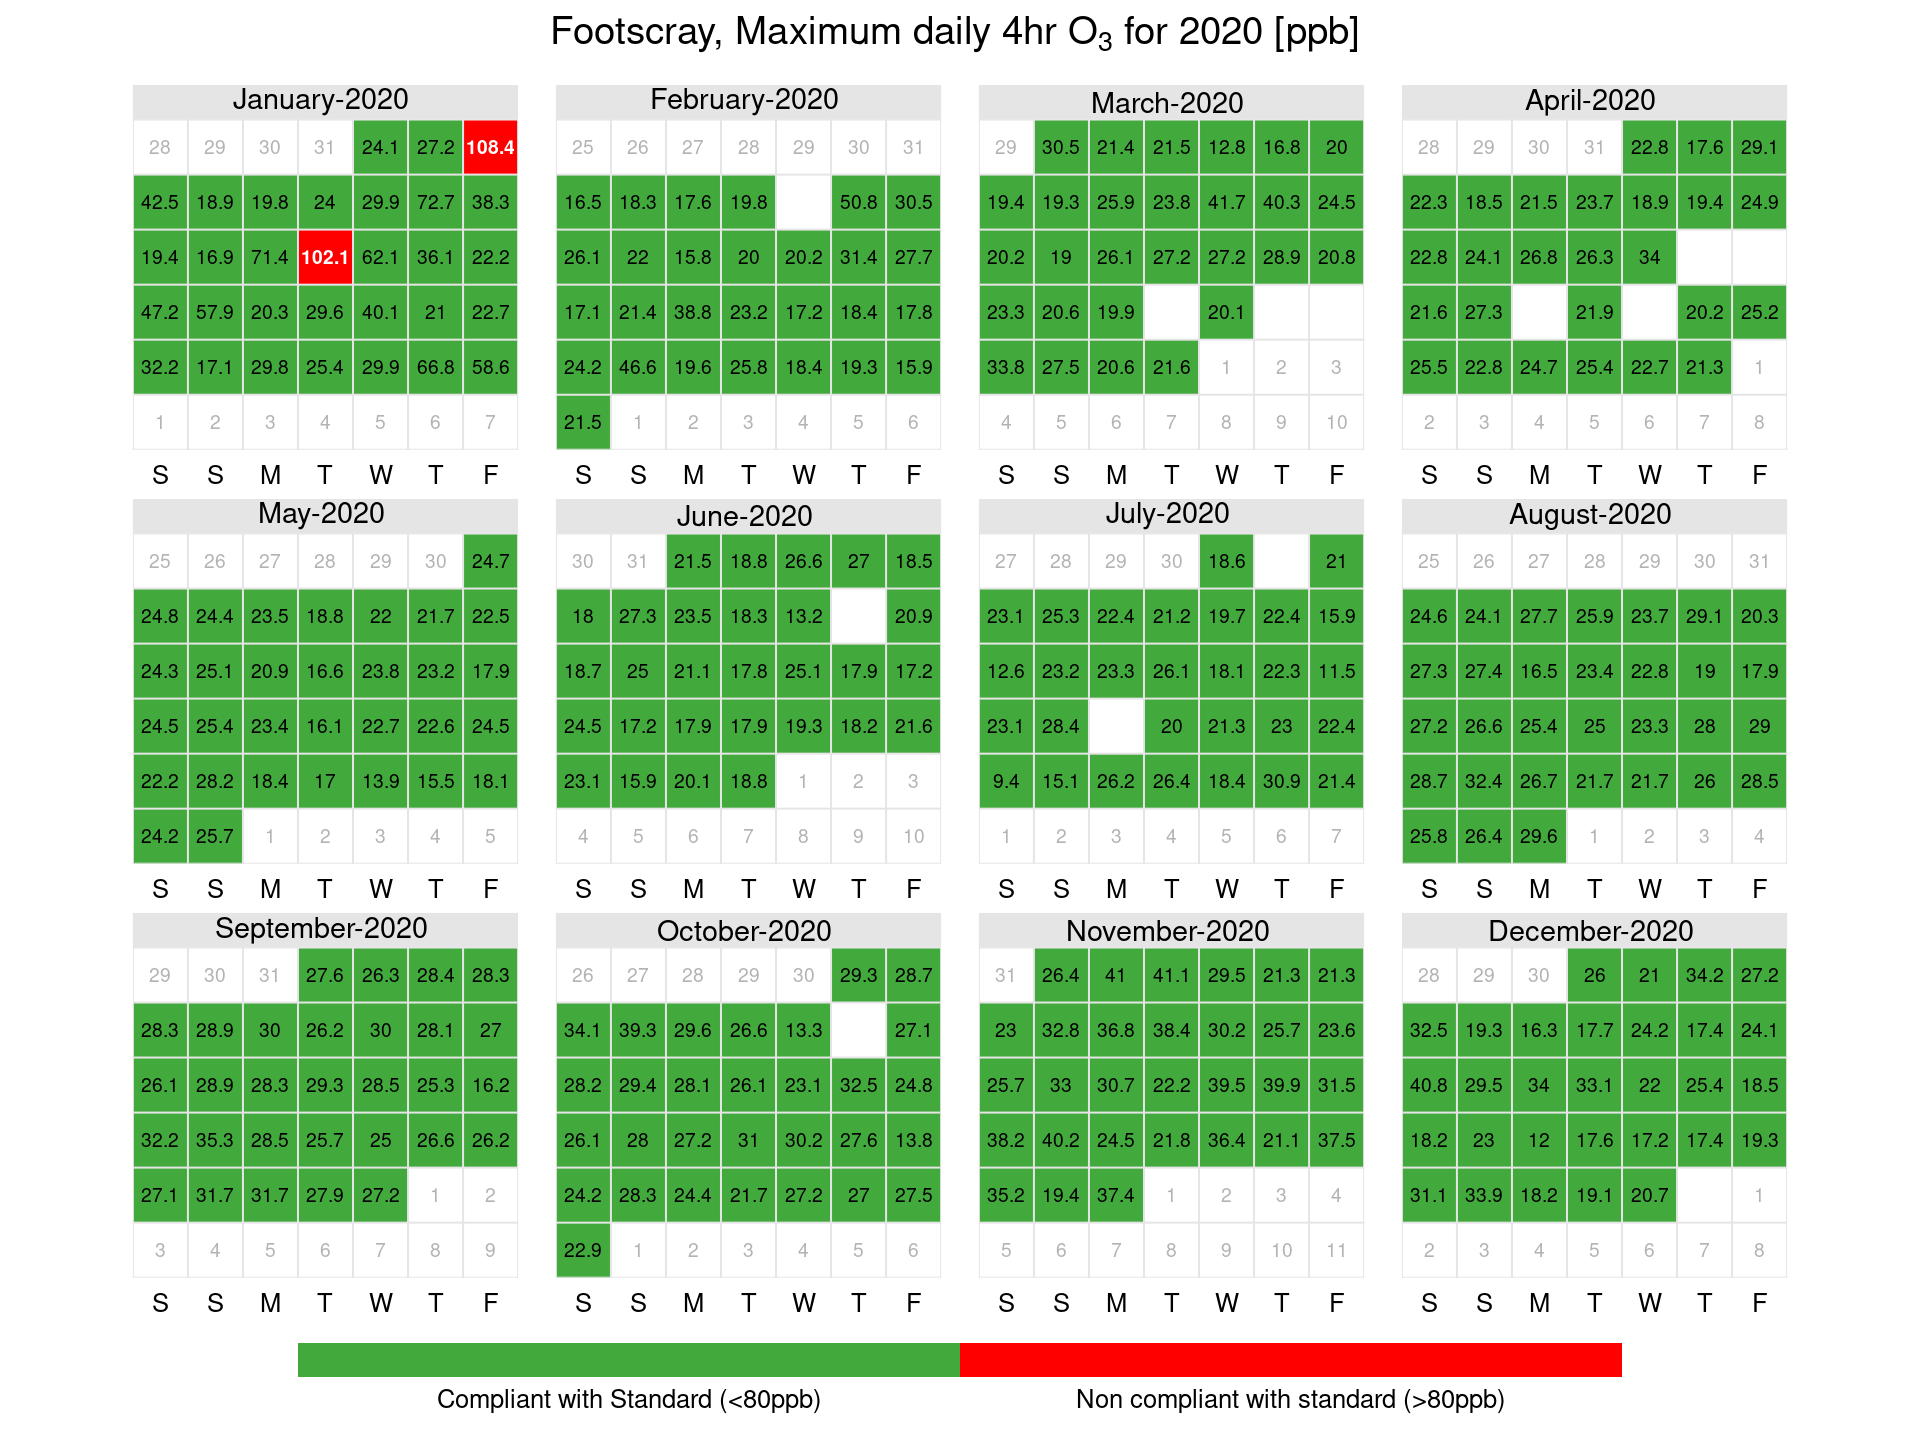
Figure 20: Geelong South ozone calendar plots showing days where exceedances of the maximum daily standard occurred in ppb
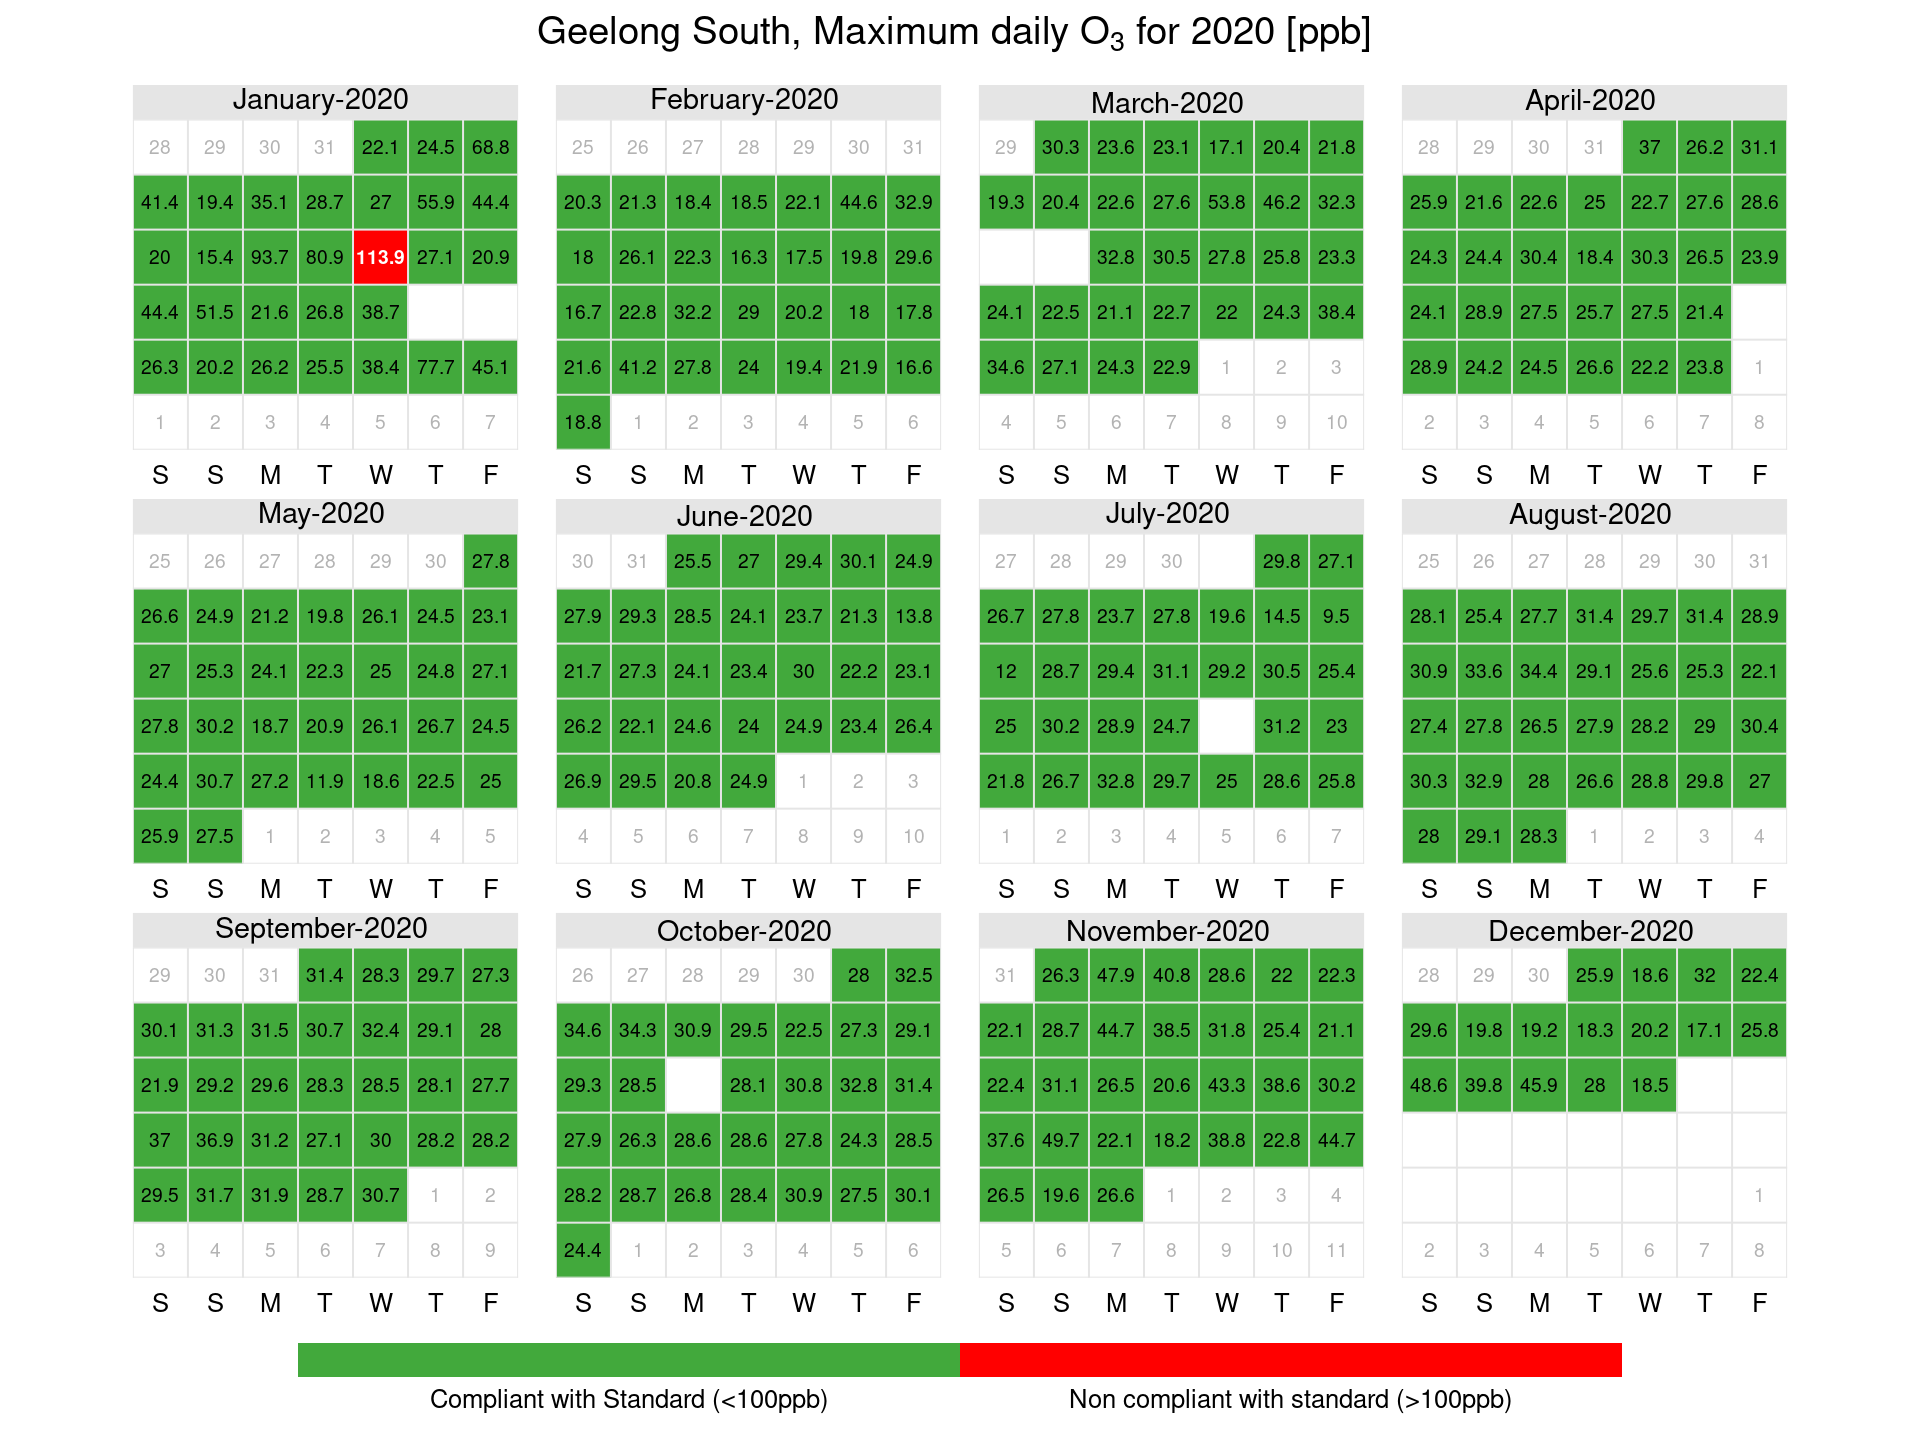
Figure 21: Geelong South 4-hour ozone calendar plots showing days where exceedances of the maximum daily standard occurred in ppb

Figure 22: Melton ozone calendar plots showing days where exceedances of the maximum daily standard occurred in ppb
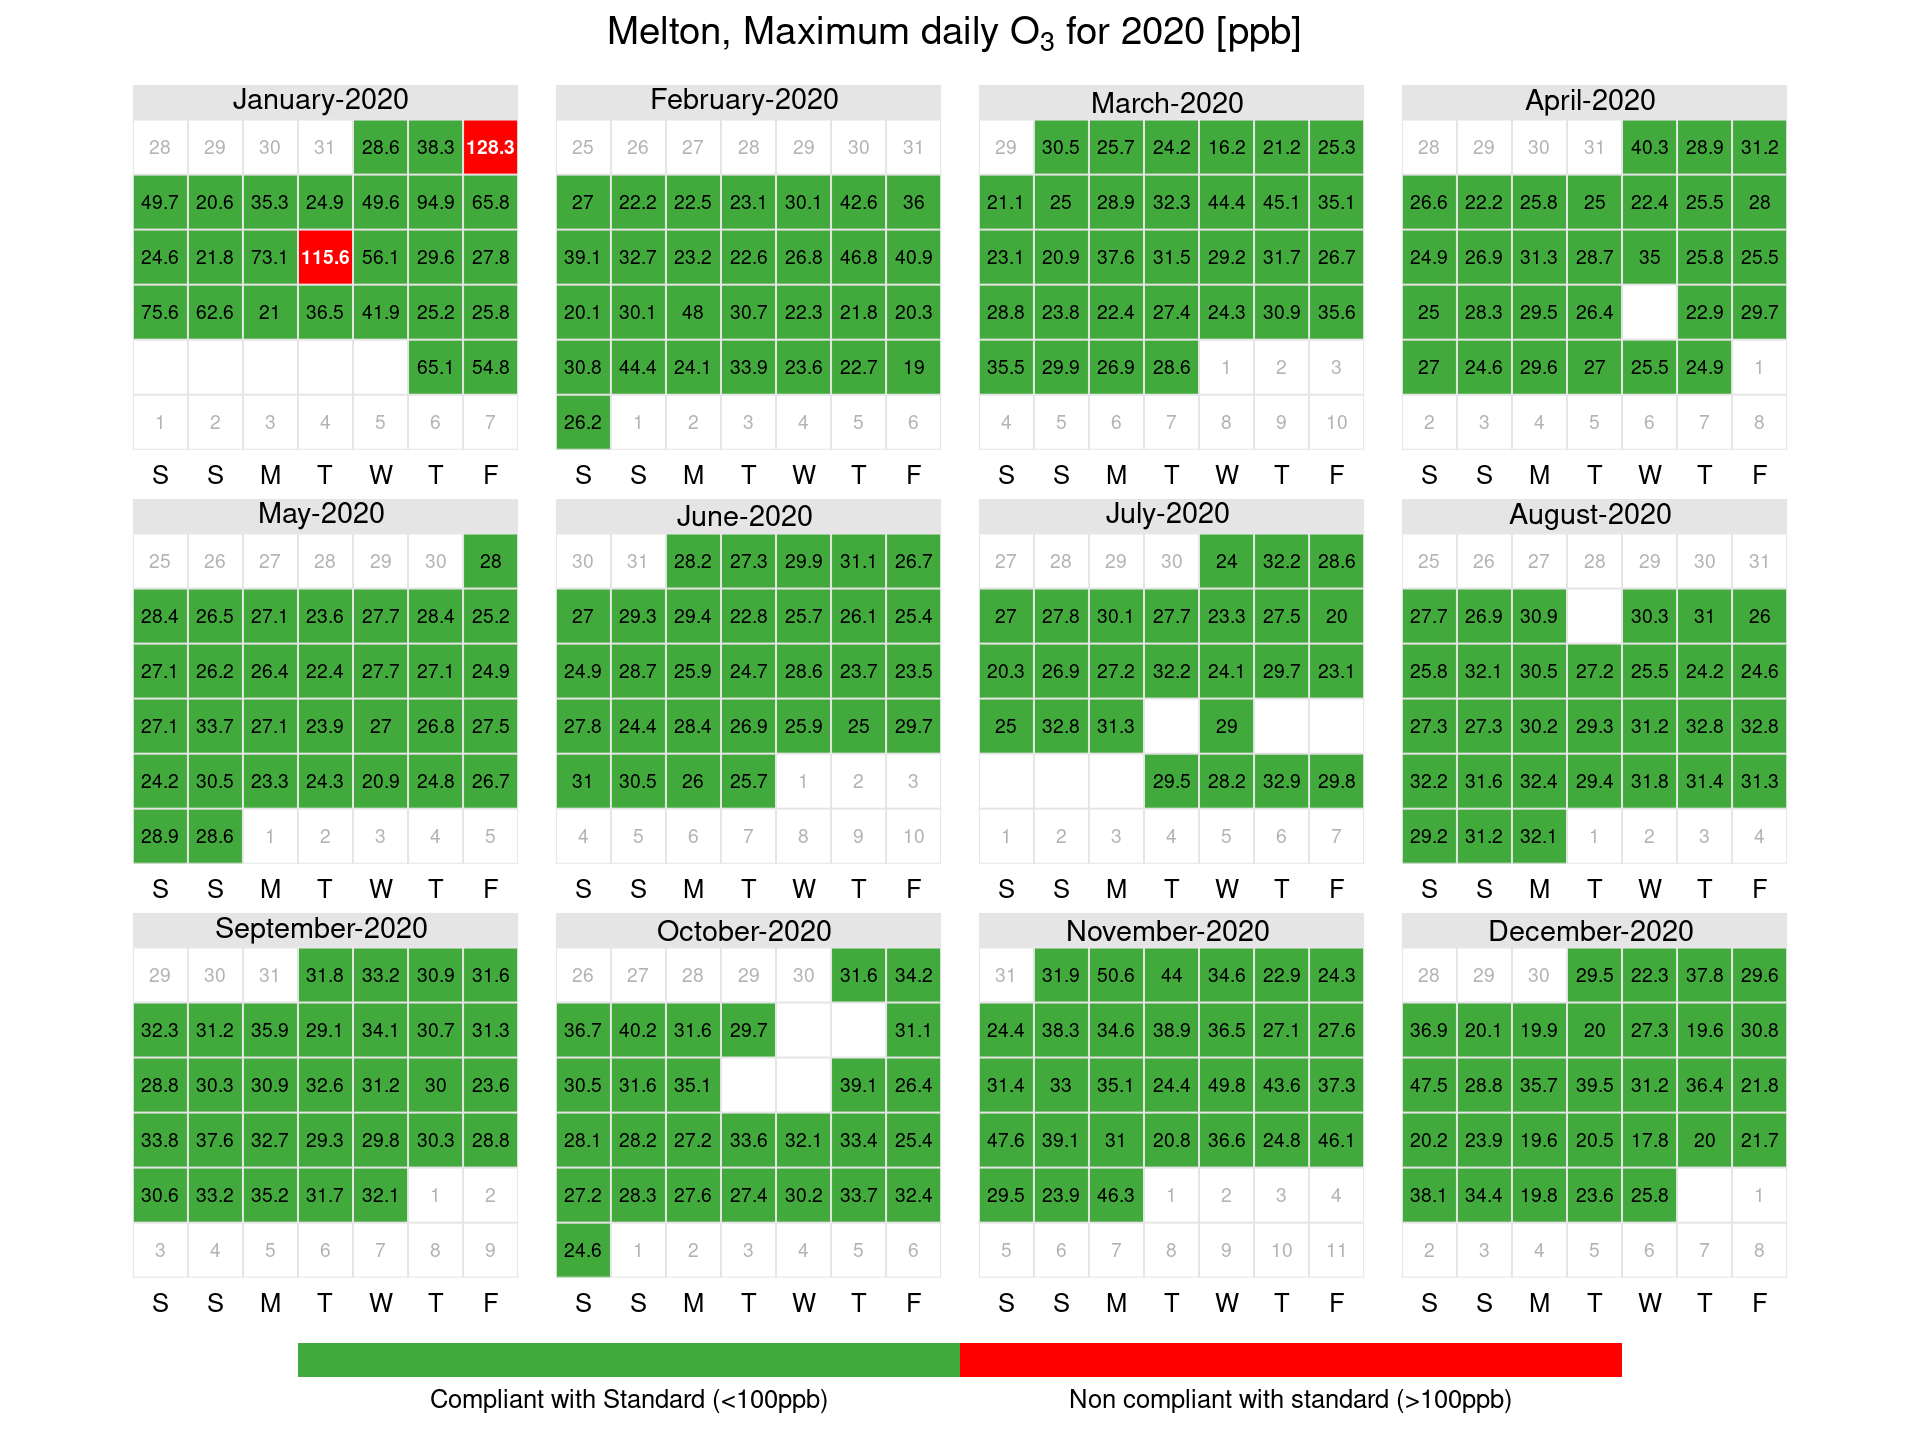
Figure 23: Melton 4-hour ozone calendar plots showing days where exceedances of the maximum daily standard occurred in ppb
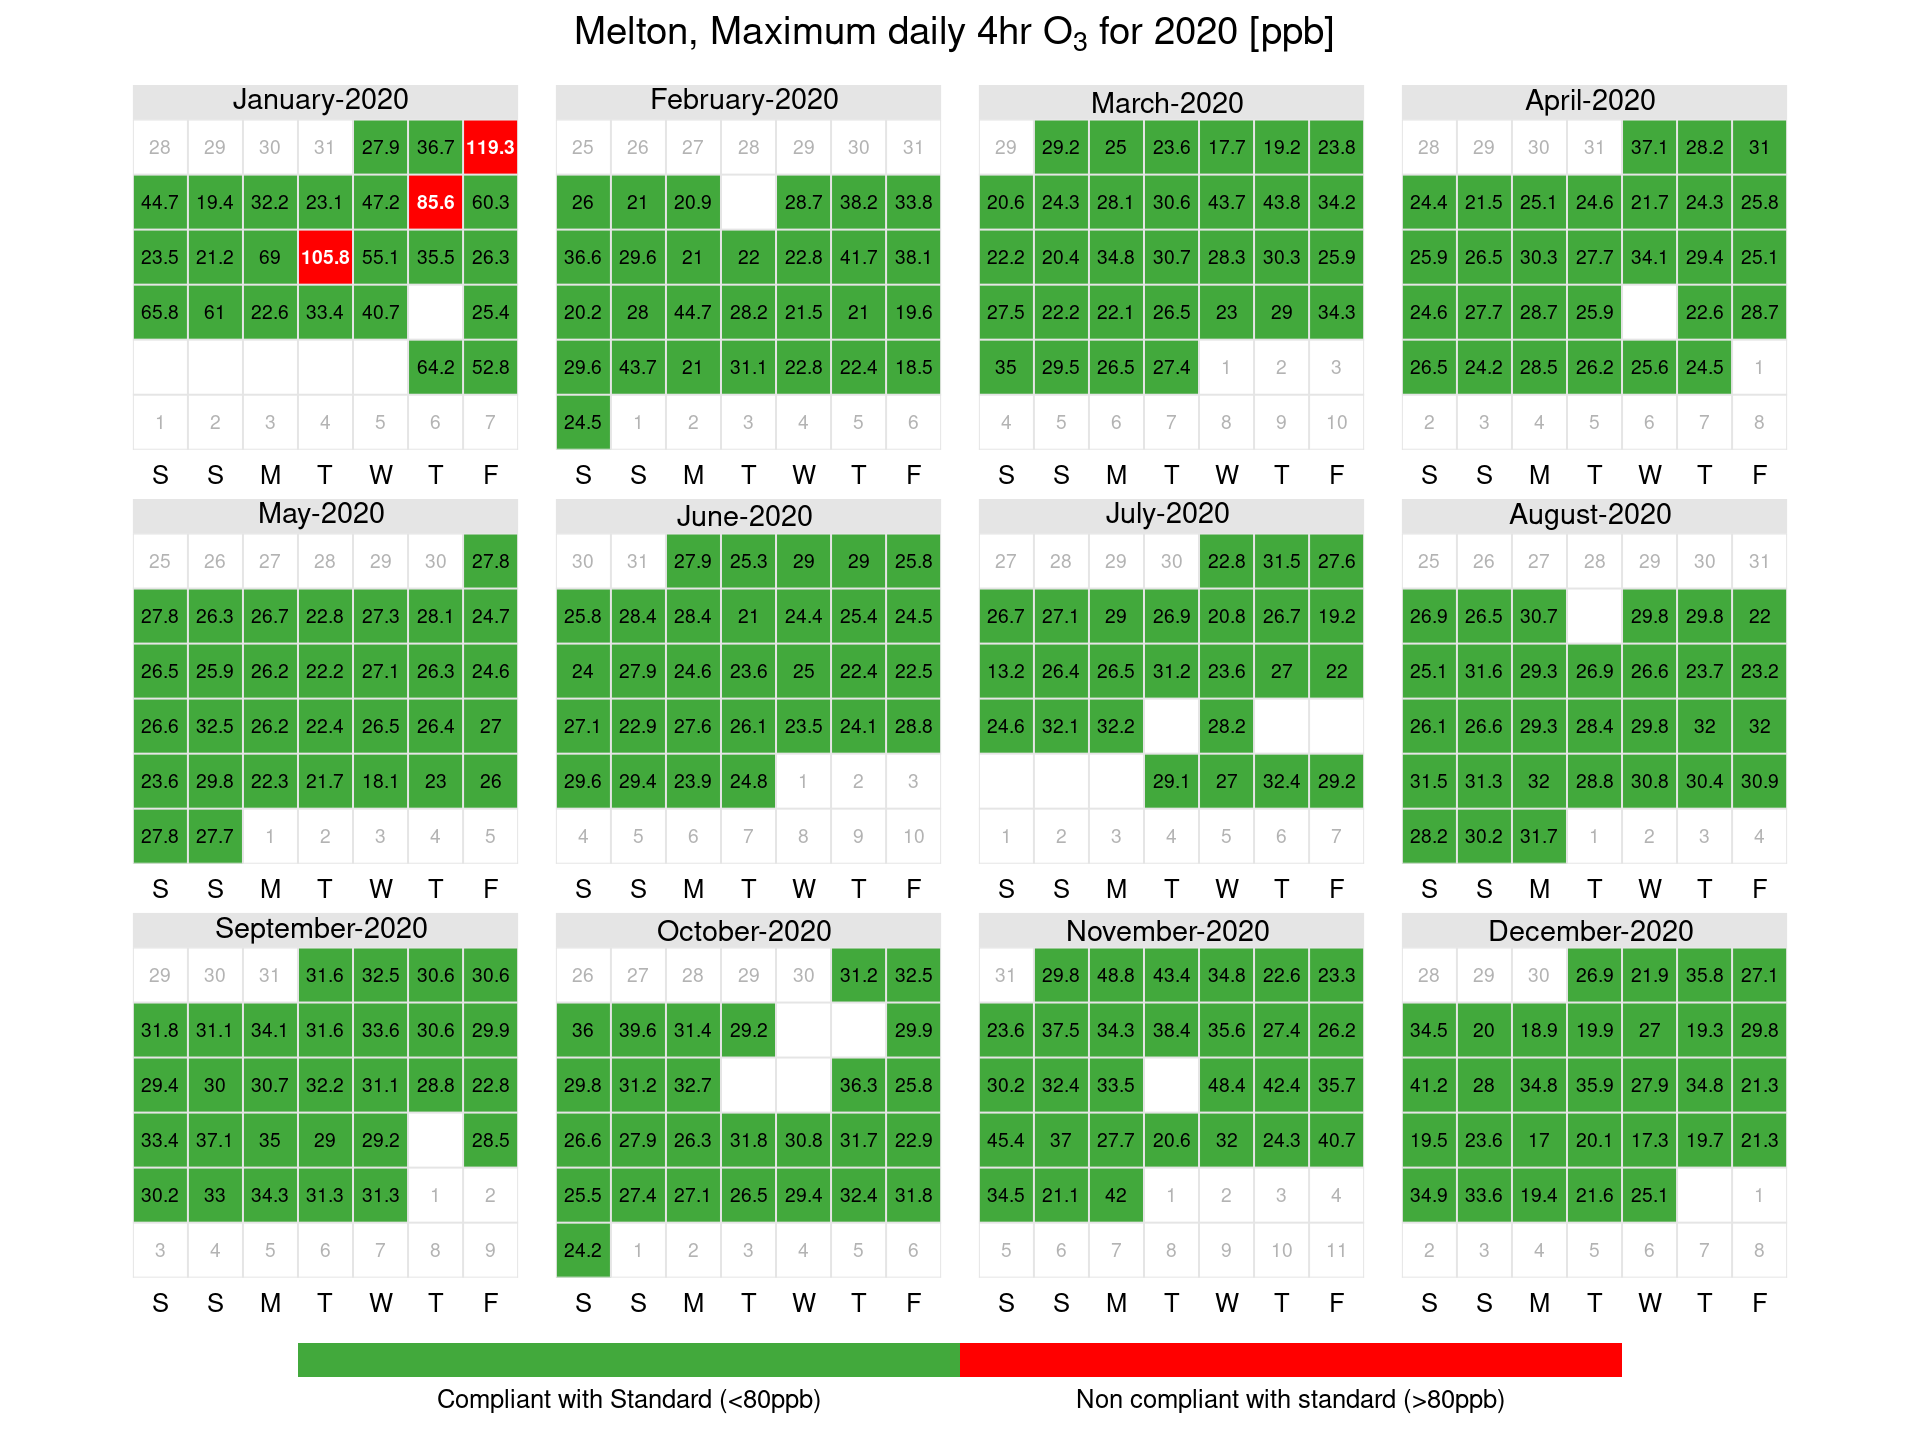
Figure 24: Point Cook ozone calendar plots showing days where exceedances of the maximum daily standard occurred in ppb

Figure 25: Point Cook 4-hour ozone calendar plots showing days where exceedances of the maximum daily standard occurred in ppb
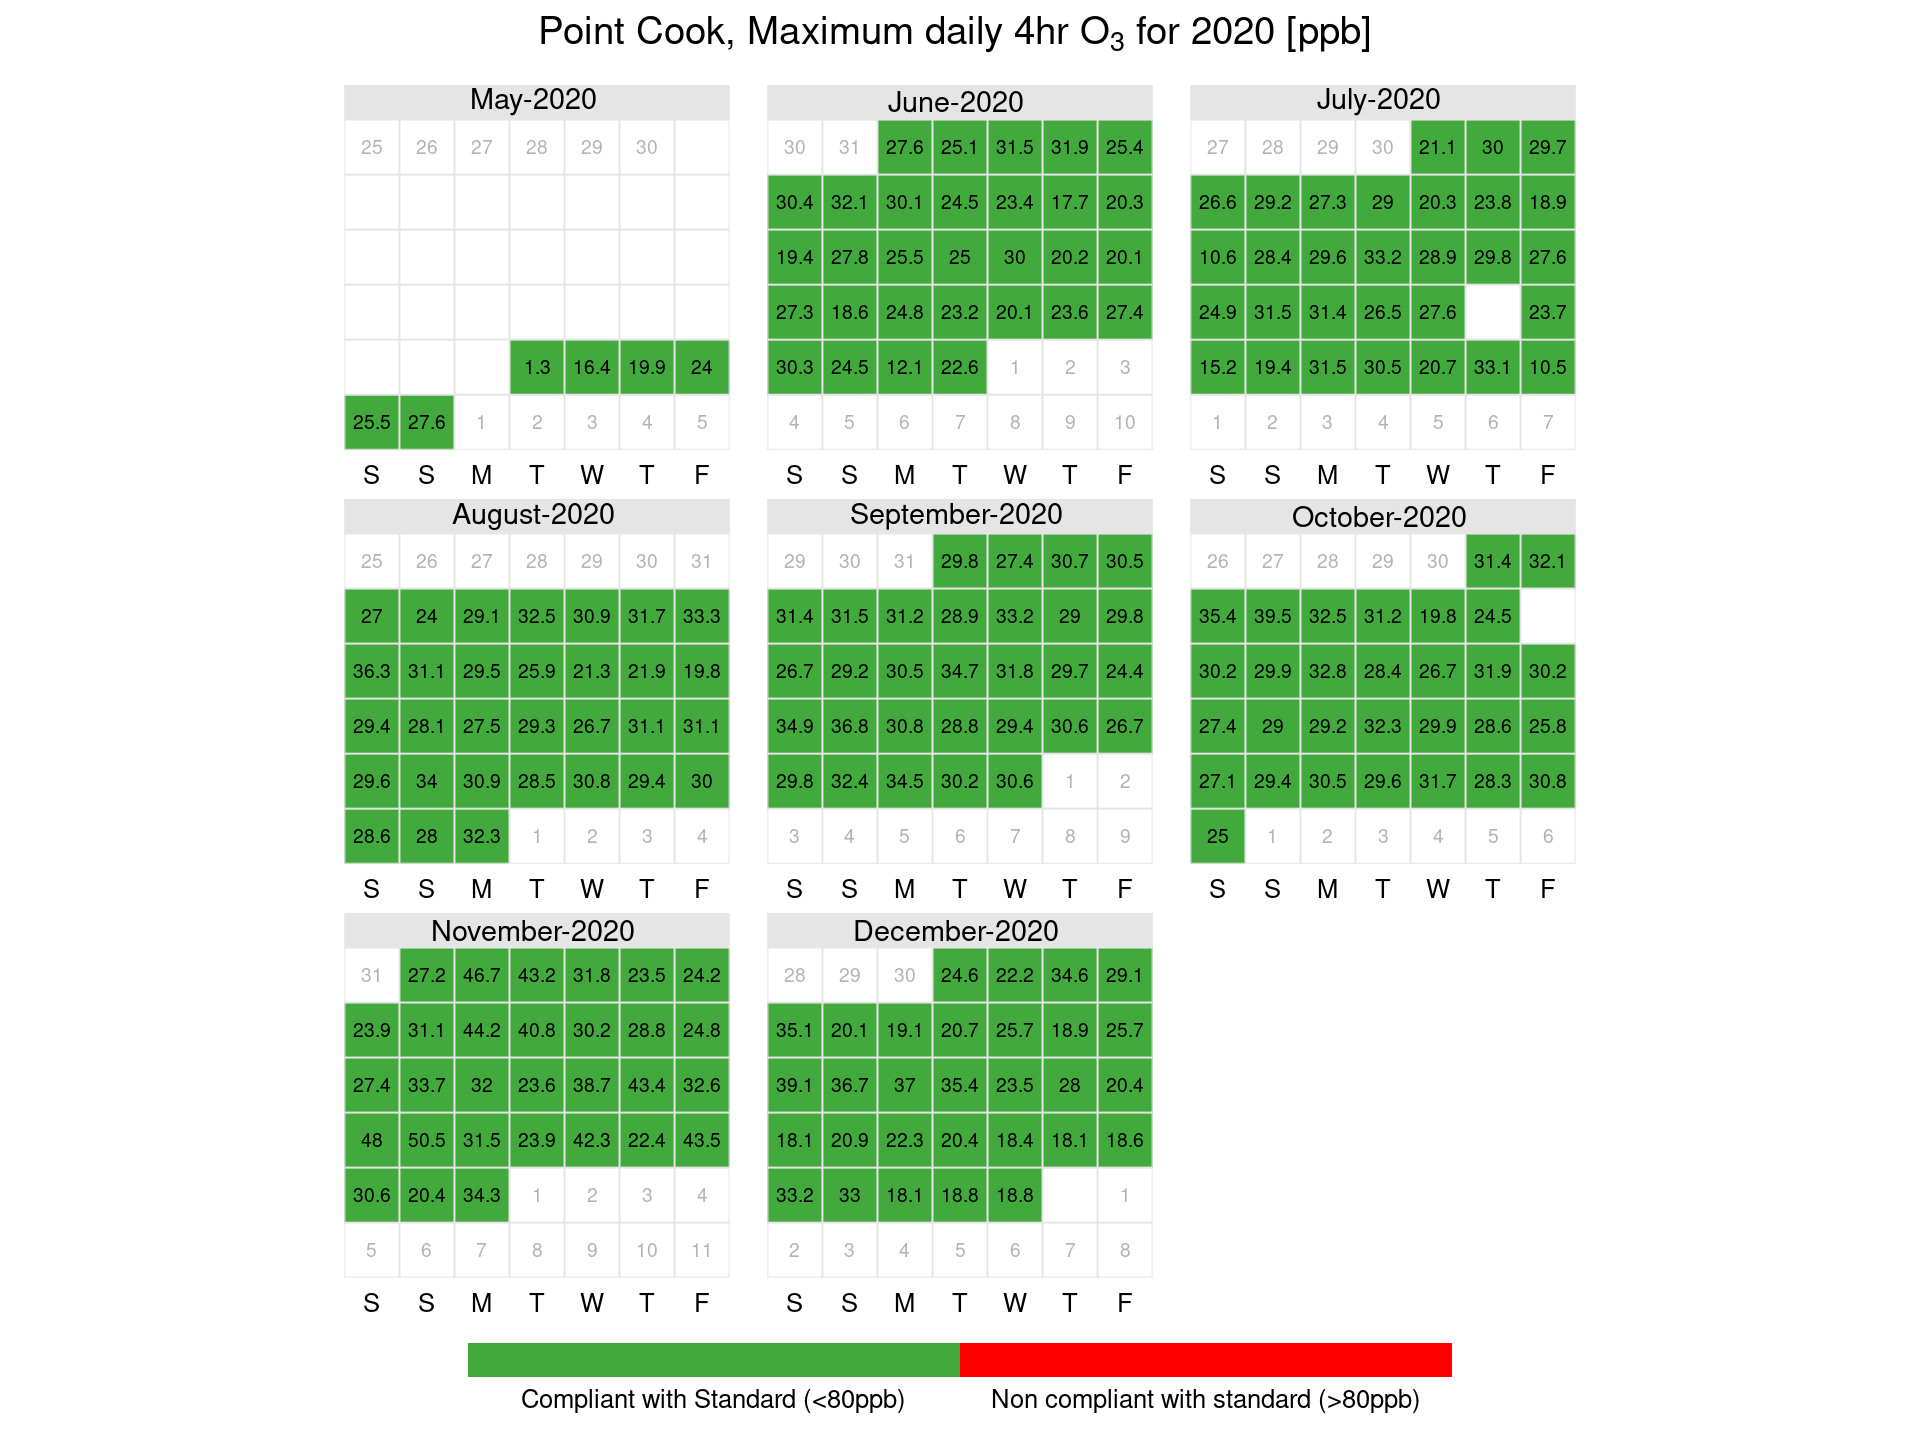
Figure 26: Traralgon ozone calendar plots showing days where exceedances of the maximum daily standard occurred in ppb

Figure 27: Traralgon 4-hour ozone calendar plots showing days where exceedances of the maximum daily standard occurred in ppb
3.6 Sulfur dioxide (SO2)
Percentiles of 2020 daily peak concentrations (over an one-hour and daily averaging periods) are provided for sulfur dioxide for each station and standard in Tables 25 and Table 26. Daily peak values are formed only when at least 75 per cent of the data for the day are valid.
There were no exceedances of the sulfur dioxide standard recorded in 2020.
Table 25: One-hour sulfur dioxide percentiles
| (% days) | Max | 99th | 98th | 95th | 90th | 75th | 50th | |
|---|---|---|---|---|---|---|---|---|
| Alphington | 84.7 | 5.3 | 4.39 | 3.85 | 2.76 | 2.2 | 1.4 | 0.8 |
| Altona North | 23.22 | 43.6 | 41.08 | 32.98 | 26.8 | 19.58 | 8.7 | 3.9 |
| Geelong South | 80.6 | 27.4 | 14.22 | 8.52 | 4.45 | 3.26 | 1.5 | 0.6 |
| Traralgon | 91.26 | 30.8 | 19.21 | 14.64 | 9.47 | 6.84 | 3.6 | 1.75 |
Table 26: Daily sulfur dioxide percentiles
| (% days) | Max | 99th | 98th | 95th | 90th | 75th | 50th | |
|---|---|---|---|---|---|---|---|---|
| Alphington | 84.7 | 2.45 | 2.01 | 1.51 | 1.13 | 0.86 | 0.57 | 0.33 |
| Altona North | 23.22 | 9.61 | 9.4 | 8.02 | 6.48 | 4.56 | 2.43 | 1.25 |
| Geelong South | 80.6 | 2.64 | 1.7 | 1.34 | 1.06 | 0.84 | 0.5 | 0.28 |
| Traralgon | 91.26 | 5.56 | 3.23 | 2.33 | 2.03 | 1.47 | 0.94 | 0.56 |
Air monitoring 2020 trend and distribution analysis
4.1 Particles (PM2.5)
Overall trends in PM2.5 are generally consistent however there is significant variation in the number of exceedances and higher percentiles depending on events during the year (Table 27 to 31). The number of exceedances and higher percentiles are greater for years were there are significant bushfires like those experienced in 2020. The higher number of exceedances and higher percentiles are not recorded for Alphington due to lack of data as a result of technical problems with the monitor.
Table 27: Alphington PM2.5 percentiles
| (% days) | (days) | Max | 99th | 98th | 95th | 90th | 75th | 50th | |
|---|---|---|---|---|---|---|---|---|---|
| 2020 | 76.50 | 7 | 35.66 | 27.89 | 25.94 | 19.05 | 13.52 | 9.01 | 6.37 |
| 2019 | 67.67 | 2 | 30.65 | 23.71 | 18.90 | 16.23 | 13.34 | 9.27 | 6.58 |
| 2018 | 87.40 | 8 | 42.01 | 29.68 | 27.23 | 17.46 | 13.36 | 8.79 | 6.52 |
| 2017 | 92.33 | 8 | 35.94 | 27.75 | 26.60 | 20.34 | 15.76 | 10.17 | 7.45+ |
| 2016 | 84.15 | 2 | 33.62 | 23.05 | 22.29 | 14.53 | 11.93 | 8.64 | 6.24 |
Table 28: Footscray PM2.5 percentiles
| (% days) | (days) | Max | 99th | 98th | 95th | 90th | 75th | 50th | |
|---|---|---|---|---|---|---|---|---|---|
| 2020 | 95.90 | 8 | 204.50 | 63.05 | 29.86 | 17.59 | 12.92 | 8.34 | 5.79 |
| 2019 | 98.08 | 4 | 31.30 | 23.83 | 20.43 | 15.06 | 12.01 | 8.66 | 6.65 |
| 2018 | 88.22 | 5 | 31.20 | 28.32 | 20.95 | 15.34 | 12.52 | 8.76 | 6.67 |
| 2017 | 96.44 | 4 | 34.77 | 24.51 | 20.72 | 15.53 | 13.06 | 9.25 | 6.75 |
| 2016 | 93.17 | 2 | 25.87 | 19.65 | 14.60 | 12.88 | 11.11 | 8.41 | 6.18 |
Table 29: Geelong South PM2.5 percentiles
| (% days) | (days) | Max | 99th | 98th | 95th | 90th | 75th | 50th | |
|---|---|---|---|---|---|---|---|---|---|
| 2020 | 86.07 | 6 | 155.05 | 66.48 | 23.39 | 15.01 | 11.71 | 7.78 | 5.50 |
| 2019 | 95.62 | 1 | 32.68 | 19.28 | 16.97 | 12.85 | 10.48 | 7.51 | 5.53 |
| 2018 | 86.58 | 1 | 31.03 | 21.87 | 18.43 | 13.66 | 10.16 | 7.70 | 5.57 |
| 2017 | 83.01 | 2 | 26.80 | 22.27 | 18.23 | 13.52 | 10.89 | 8.50 | 6.42 |
| 2016 | 36.34 | 0 | 13.53 | 11.98 | 10.66 | 9.69 | 8.41 | 6.72 | 5.24 |
Table 30: Melbourne CBD PM2.5 percentiles
| (% days) | (days) | Max | 99th | 98th | 95th | 90th | 75th | 50th | |
|---|---|---|---|---|---|---|---|---|---|
| 2020 | 96.99 | 10 | 196.31 | 69.19 | 26.92 | 18.54 | 12.81 | 7.67 | 5.28 |
| 2019 | 93.70 | 2 | 27.95 | 21.59 | 19.07 | 14.20 | 12.35 | 8.22 | 5.81 |
| 2018 | 94.79 | 7 | 42.14 | 32.43 | 23.97 | 17.07 | 12.79 | 9.07 | 6.81 |
| 2017 | 62.19 | 3 | 28.66 | 26.54 | 23.74 | 17.92 | 13.34 | 9.62 | 7.13 |
Table 31: Traralgon PM2.5 percentiles
| (% days) | (days) | Max | 99th | 98th | 95th | 90th | 75th | 50th | |
|---|---|---|---|---|---|---|---|---|---|
| 2020 | 89.07 | 5 | 236.00 | 31.42 | 23.29 | 18.49 | 14.49 | 9.94 | 6.74 |
| 2019 | 95.07 | 8 | 37.40 | 31.42 | 26.15 | 19.23 | 14.87 | 10.73 | 7.48 |
| 2018 | 87.12 | 2 | 30.08 | 23.21 | 22.26 | 17.75 | 13.39 | 9.66 | 6.86 |
| 2017 | 86.85 | 5 | 32.26 | 27.98 | 21.98 | 18.34 | 14.85 | 9.84 | 7.19 |
| 2016 | 94.81 | 1 | 25.69 | 22.89 | 20.64 | 15.63 | 12.47 | 9.31 | 6.91 |
4.2 Population exposure (PM2.5)
In order to estimate concentrations where there are no EPA air monitoring stations, modelled concentrations of PM2.5 are used. This has been carried out using the CSIRO Air Quality Forecasting (AQFx) system. The modelling results as shown in Figure 28 and Figure 29 show that the highest levels and impacts from the bushfires which occurred in eastern Victoria.
Figure 28: Modelled PM2.5 annual average concentration (µg/m3) for 2020
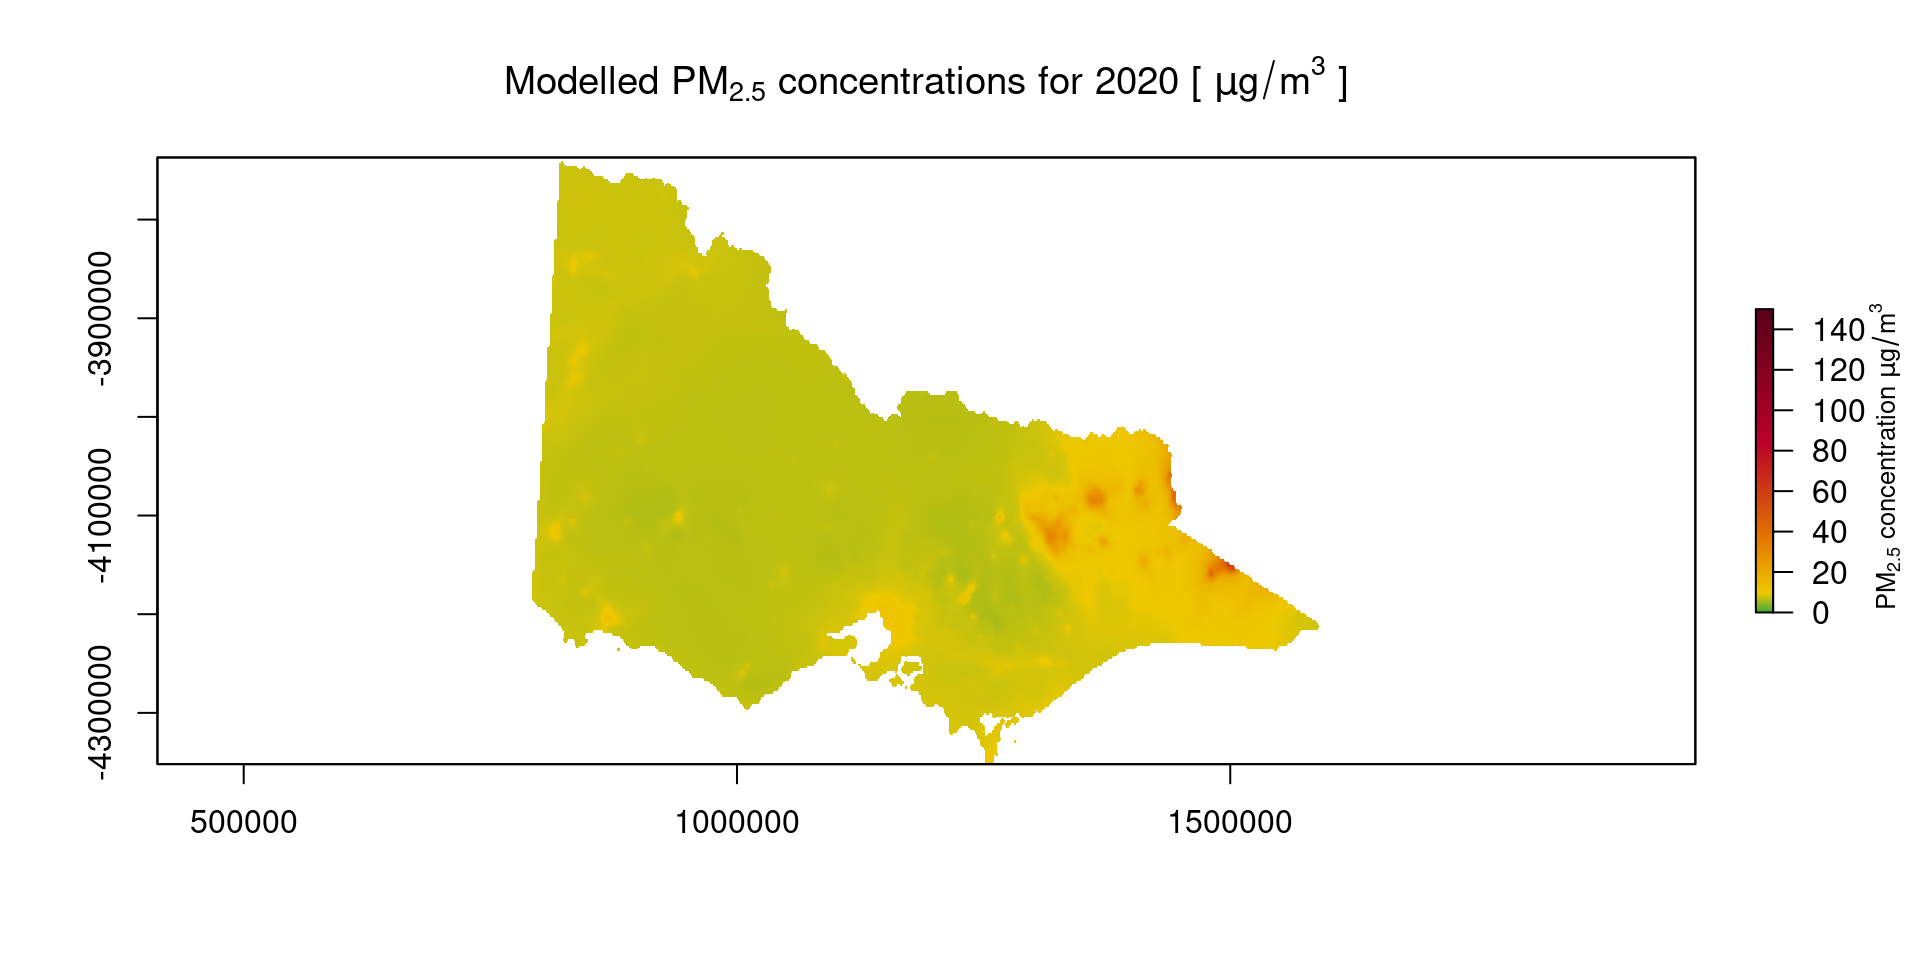
Figure 29: Modelled PM2.5 annual average concentration (µg/m3) for 2019
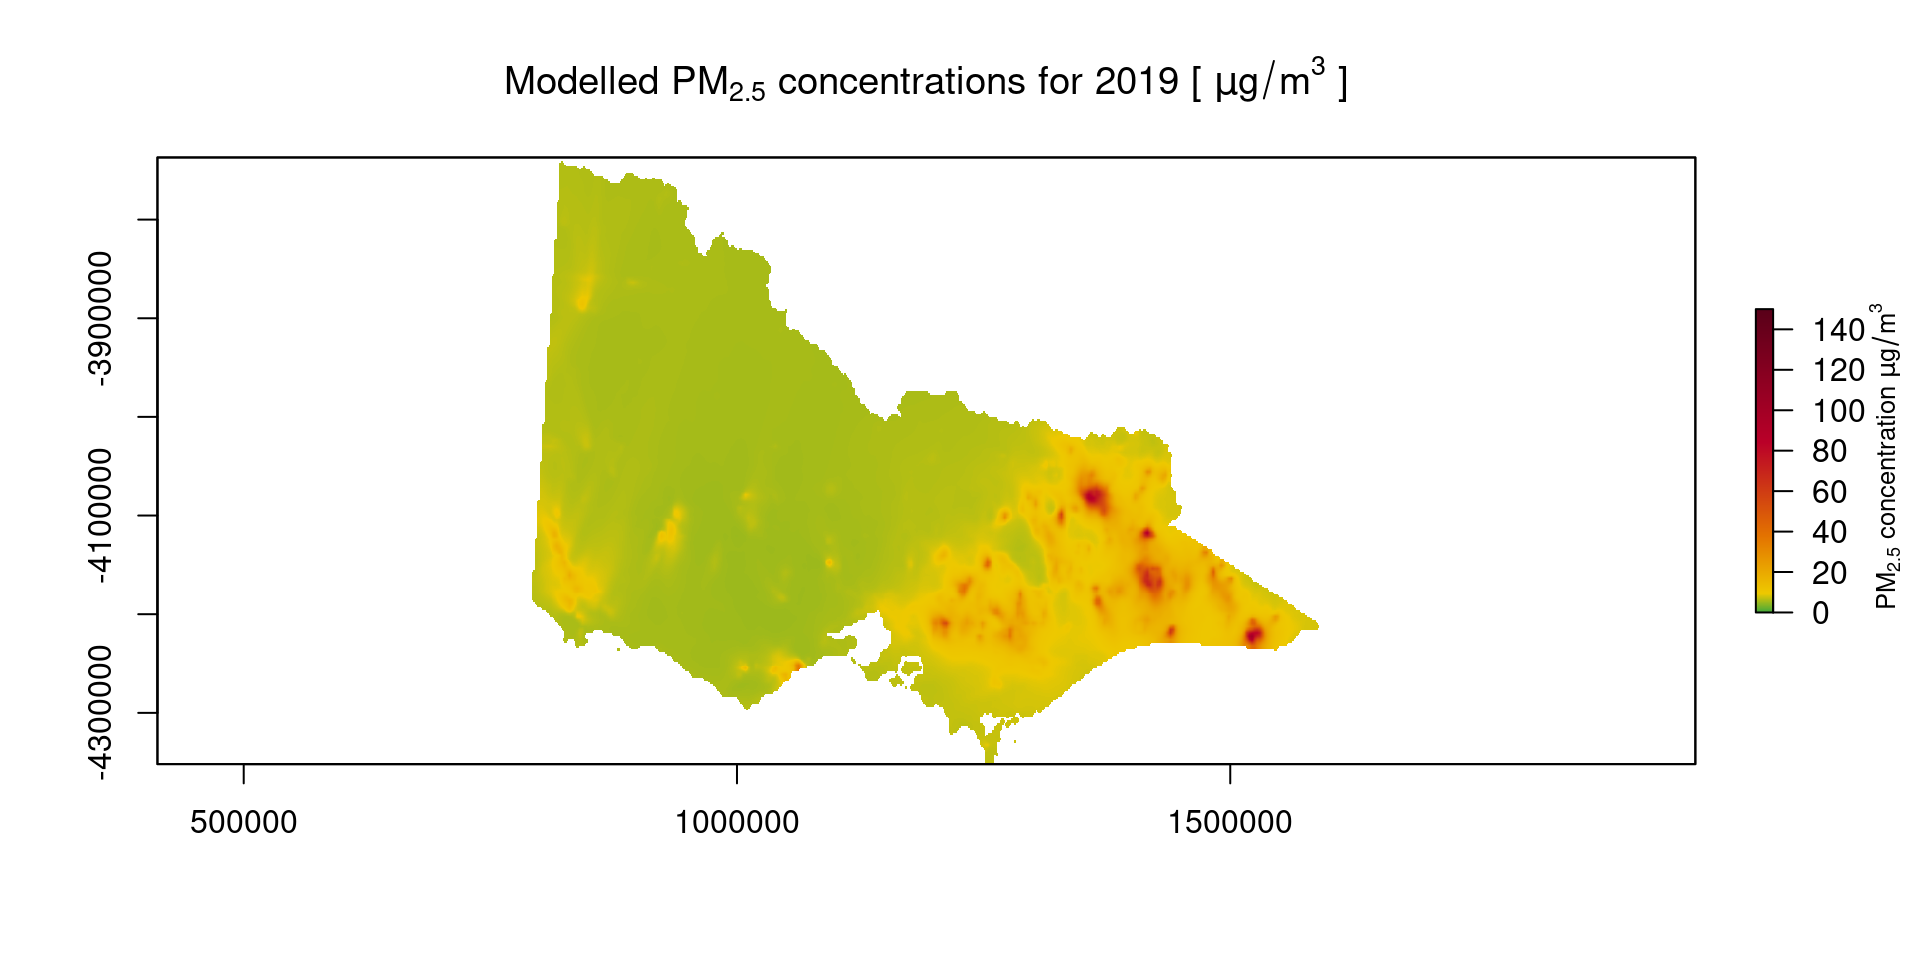
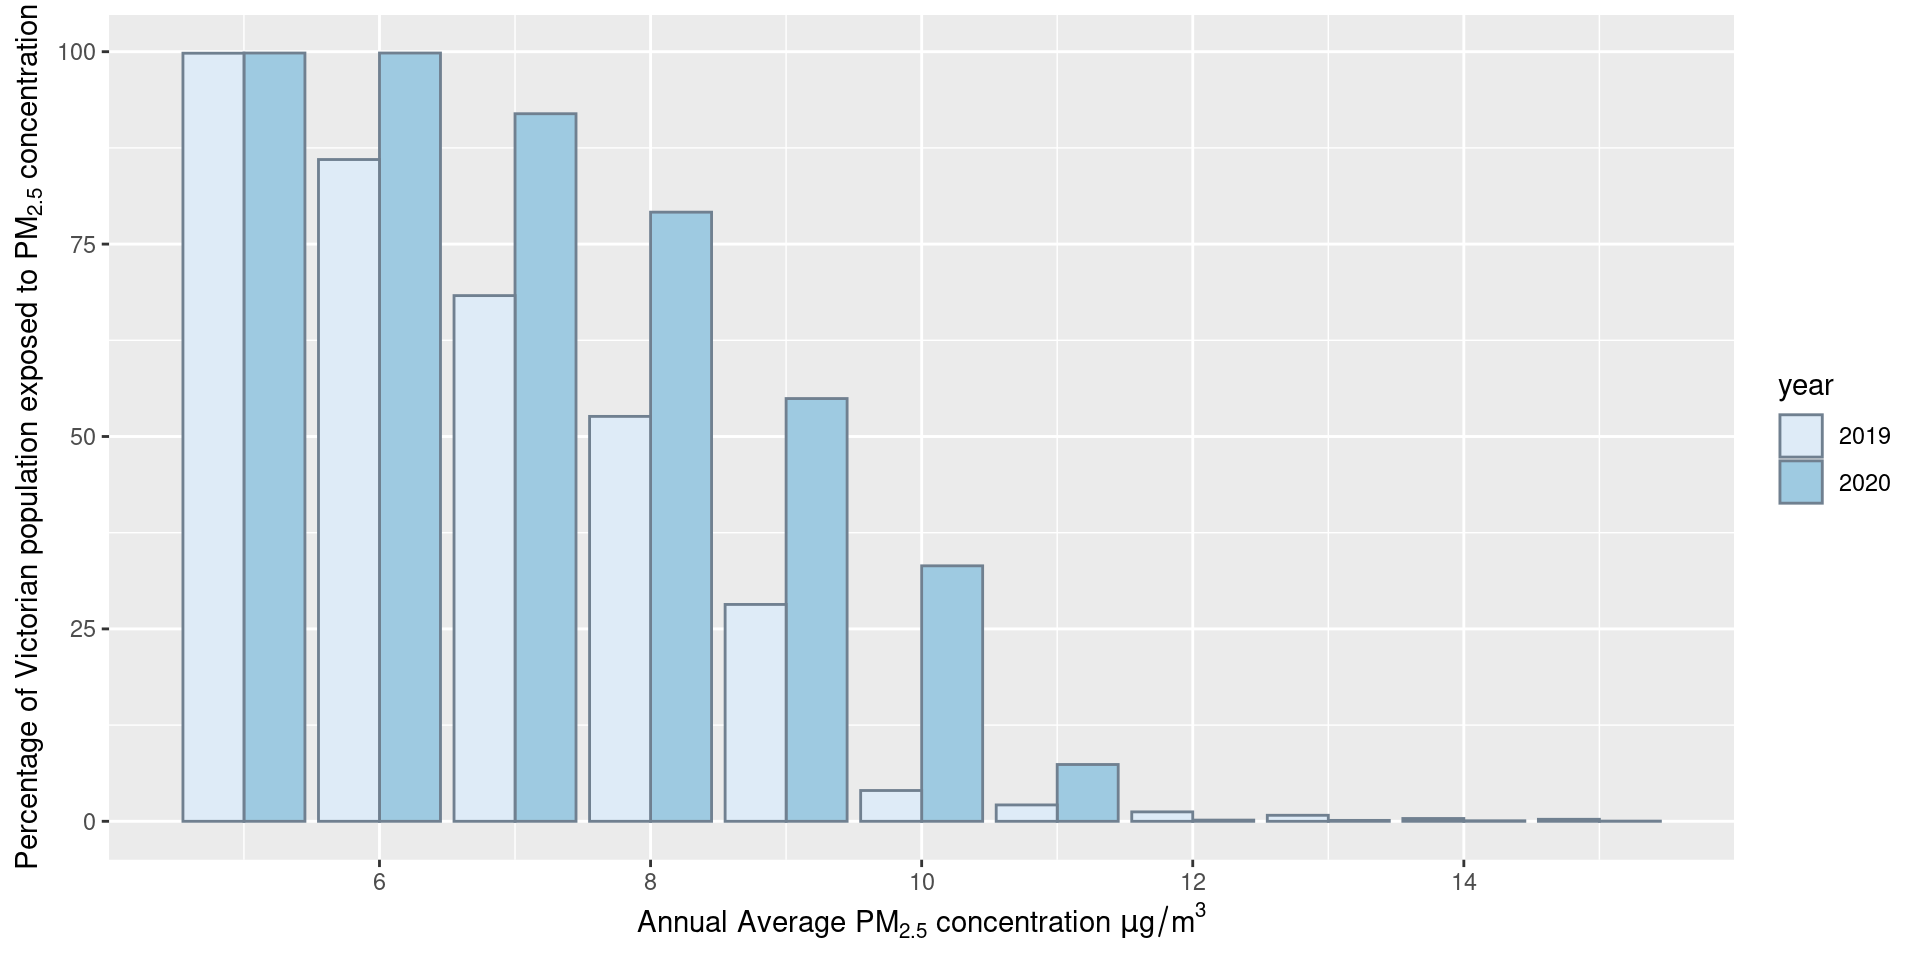
Table 32: Percentage of population exposed to PM2.5 concentrations (µg/m3)
| 5 | 6 | 7 | 8 | 9 | 10 | 11 | 12 | 13 | 14 | 15 | 20 | 25 | 30 | 35 | 40 | |
|---|---|---|---|---|---|---|---|---|---|---|---|---|---|---|---|---|
| 2020 | 99.829 | 99.829 | 91.942 | 79.151 | 54.932 | 33.198 | 7.382 | 0.158 | 0.121 | 0.071 | 0.028 | 0.006 | 0.003 | 0.001 | 0.001 | 0.000 |
| 2019 | 99.807 | 85.991 | 68.310 | 52.614 | 28.180 | 4.004 | 2.129 | 1.227 | 0.784 | 0.365 | 0.263 | 0.112 | 0.048 | 0.024 | 0.014 | 0.005 |
Figure 30
4.3 Particles (PM10)
Overall trends in PM10 as shown in Tables 33 to 38 are generally consistent from year to year, however there can be significant variation in the number of exceedances and higher percentiles depending on events during the year. The number of exceedances and higher percentiles are greater for years where there are significant bushfires like those experienced in 2020.
Table 33: Alphington PM10 percentiles
| (% days) | (days) | Max | 99th | 98th | 95th | 90th | 75th | 50th | |
|---|---|---|---|---|---|---|---|---|---|
| 2020 | 92.35 | 7 | 226.48 | 68.99 | 48.01 | 37.08 | 28.96 | 21.98 | 16.22 |
| 2019 | 95.34 | 5 | 69.81 | 55.26 | 45.29 | 37.27 | 31.98 | 23.08 | 16.80 |
| 2018 | 90.96 | 3 | 73.99 | 47.44 | 46.25 | 38.33 | 31.07 | 22.56 | 17.34 |
| 2017 | 95.89 | 0 | 41.08 | 32.51 | 31.22 | 27.27 | 24.09 | 20.00 | 15.83 |
| 2016 | 94.54 | 0 | 37.94 | 34.23 | 31.35 | 27.49 | 24.21 | 18.58 | 14.05 |
Table 34: Dandenong PM10 percentiles
| (% days) | (days) | Max | 99th | 98th | 95th | 90th | 75th | 50th | |
|---|---|---|---|---|---|---|---|---|---|
| 2020 | 91.26 | 9 | 259.12 | 87.27 | 62.22 | 37.08 | 29.81 | 23.21 | 17.57 |
| 2019 | 94.52 | 9 | 144.03 | 78.72 | 56.55 | 40.81 | 35.45 | 26.27 | 18.24 |
| 2018 | 95.89 | 3 | 89.74 | 47.63 | 40.59 | 33.51 | 28.95 | 24.08 | 17.37 |
| 2017 | 23.29 | 0 | 37.53 | 35.29 | 34.13 | 29.92 | 28.00 | 22.60 | 16.69 |
| 2016 | 72.13 | 0 | 41.78 | 38.86 | 34.65 | 31.81 | 27.27 | 20.69 | 14.47 |
Table 35: Footscray PM10 percentiles
| (% days) | (days) | Max | 99th | 98th | 95th | 90th | 75th | 50th | |
|---|---|---|---|---|---|---|---|---|---|
| 2020 | 87.43 | 1 | 50.95 | 36.12 | 35.46 | 31.24 | 25.93 | 20.96 | 15.45 |
| 2019 | 79.73 | 7 | 66.92 | 52.89 | 51.18 | 39.85 | 33.19 | 24.30 | 17.38 |
| 2018 | 95.89 | 1 | 58.77 | 46.15 | 42.31 | 35.06 | 29.54 | 23.44 | 17.19 |
| 2017 | 91.23 | 0 | 49.83 | 39.53 | 36.59 | 30.99 | 28.09 | 23.04 | 17.40 |
| 2016 | 94.26 | 0 | 42.66 | 37.88 | 35.11 | 30.05 | 25.97 | 20.24 | 14.18 |
Table 36: Geelong South PM10 percentiles
| (% days) | (days) | Max | 99th | 98th | 95th | 90th | 75th | 50th | |
|---|---|---|---|---|---|---|---|---|---|
| 2020 | 69.40 | 6 | 199.41 | 143.66 | 61.38 | 40.11 | 32.17 | 25.35 | 17.96 |
| 2019 | 88.49 | 11 | 101.51 | 70.42 | 63.85 | 45.75 | 36.86 | 24.16 | 17.20 |
| 2018 | 93.70 | 6 | 97.08 | 70.13 | 46.71 | 41.49 | 33.85 | 25.03 | 17.52 |
| 2017 | 81.10 | 3 | 73.73 | 44.33 | 39.57 | 32.41 | 29.61 | 22.82 | 16.43 |
| 2016 | 93.17 | 5 | 68.35 | 57.22 | 47.29 | 37.36 | 30.42 | 21.94 | 15.89 |
Table 37: Mooroolbark PM10 percentiles
| (% days) | (days) | Max | 99th | 98th | 95th | 90th | 75th | 50th | |
|---|---|---|---|---|---|---|---|---|---|
| 2020 | 89.07 | 4 | 76.06 | 51.00 | 38.43 | 31.01 | 23.41 | 18.40 | 13.91 |
| 2019 | 97.53 | 4 | 75.10 | 49.98 | 42.61 | 35.02 | 30.46 | 21.57 | 15.14 |
| 2018 | 95.62 | 1 | 111.25 | 34.65 | 33.69 | 29.16 | 25.31 | 20.22 | 15.24 |
| 2017 | 96.16 | 2 | 55.45 | 36.35 | 31.25 | 24.49 | 21.60 | 18.54 | 14.39 |
| 2016 | 95.36 | 0 | 44.68 | 32.48 | 29.70 | 26.33 | 22.49 | 17.43 | 12.53 |
Table 38: Traralgon PM10 percentiles
| (% days) | (days) | Max | 99th | 98th | 95th | 90th | 75th | 50th | |
|---|---|---|---|---|---|---|---|---|---|
| 2020 | 90.71 | 9 | 236.31 | 156.55 | 62.43 | 32.88 | 27.07 | 22.70 | 17.22 |
| 2019 | 95.07 | 5 | 77.99 | 52.84 | 46.31 | 35.91 | 29.42 | 22.88 | 16.70 |
| 2018 | 95.62 | 0 | 50.08 | 34.09 | 28.49 | 25.91 | 22.87 | 18.85 | 14.82 |
| 2017 | 91.78 | 0 | 42.83 | 32.17 | 28.44 | 24.57 | 21.75 | 17.98 | 14.70 |
| 2016 | 97.54 | 0 | 49.19 | 36.07 | 30.26 | 25.45 | 21.88 | 17.45 | 14.02 |
4.4 Carbon monoxide (CO)
Overall trends in carbon monoxide as shown in Tables 39 to 42 are generally consistent from year to year, however there can be significant variation in the number of exceedances and higher percentiles depending on events during the year. The number of exceedances and higher percentiles are greater for years where there are significant bushfires like those experienced in 2020.
Table39: Alphington 8-hour carbon monoxide percentiles
| (% days) | (days) | Max | 99th | 98th | 95th | 90th | 75th | 50th | |
|---|---|---|---|---|---|---|---|---|---|
| 2020 | 88.52 | 0 | 2.25 | 1.35 | 1.21 | 0.99 | 0.74 | 0.41 | 0.22 |
| 2019 | 86.03 | 0 | 1.17 | 0.84 | 0.73 | 0.61 | 0.47 | 0.35 | 0.23 |
| 2018 | 92.88 | 0 | 1.71 | 1.27 | 1.11 | 0.87 | 0.70 | 0.41 | 0.27 |
| 2017 | 93.15 | 0 | 1.49 | 1.37 | 1.24 | 1.12 | 0.88 | 0.43 | 0.31 |
| 2016 | 88.80 | 0 | 2.01 | 1.32 | 1.18 | 0.94 | 0.78 | 0.49 | 0.33 |
Table 40: Footscray 8-hour carbon monoxide percentiles
| (% days) | (days) | Max | 99th | 98th | 95th | 90th | 75th | 50th | |
|---|---|---|---|---|---|---|---|---|---|
| 2020 | 92.62 | 0 | 2.84 | 1.30 | 1.19 | 0.68 | 0.49 | 0.29 | 0.20 |
| 2019 | 85.21 | 0 | 1.11 | 0.67 | 0.60 | 0.47 | 0.36 | 0.26 | 0.18 |
| 2018 | 86.30 | 0 | 0.97 | 0.71 | 0.64 | 0.59 | 0.47 | 0.29 | 0.18 |
| 2017 | 91.23 | 0 | 1.11 | 0.91 | 0.81 | 0.60 | 0.47 | 0.30 | 0.19 |
| 2016 | 90.44 | 0 | 1.35 | 0.72 | 0.66 | 0.55 | 0.46 | 0.28 | 0.18 |
Table 41: Geelong South 8-hour carbon monoxide percentiles
| (% days) | (days) | Max | 99th | 98th | 95th | 90th | 75th | 50th | |
|---|---|---|---|---|---|---|---|---|---|
| 2020 | 87.98 | 0 | 3.04 | 1.55 | 0.87 | 0.62 | 0.47 | 0.26 | 0.19 |
| 2019 | 92.88 | 0 | 1.46 | 0.85 | 0.71 | 0.49 | 0.31 | 0.22 | 0.15 |
| 2018 | 81.92 | 0 | 1.07 | 0.81 | 0.73 | 0.58 | 0.44 | 0.26 | 0.18 |
| 2017 | 92.33 | 0 | 1.01 | 0.92 | 0.79 | 0.48 | 0.40 | 0.27 | 0.19 |
| 2016 | 86.34 | 0 | 1.72 | 0.84 | 0.80 | 0.59 | 0.38 | 0.25 | 0.17 |
Table 42: Traralgon 8-hour carbon monoxide percentiles
| (% days) | (days) | Max | 99th | 98th | 95th | 90th | 75th | 50th | |
|---|---|---|---|---|---|---|---|---|---|
| 2020 | 87.16 | 0 | 4.94 | 2.59 | 1.24 | 0.87 | 0.69 | 0.49 | 0.22 |
| 2019 | 90.14 | 0 | 1.19 | 0.96 | 0.87 | 0.62 | 0.54 | 0.35 | 0.21 |
| 2018 | 96.16 | 0 | 1.23 | 0.76 | 0.72 | 0.65 | 0.51 | 0.31 | 0.19 |
| 2017 | 88.77 | 0 | 1.14 | 0.91 | 0.84 | 0.77 | 0.61 | 0.37 | 0.24 |
| 2016 | 95.08 | 0 | 1.06 | 0.76 | 0.73 | 0.61 | 0.52 | 0.39 | 0.21 |
4.5 Nitrogen dioxide (NO2)
Overall trends in nitrogen dioxide concentrations as shown in Tables 43 to 46 are generally consistent from year to year.
Table 43: Alphington nitrogen dioxide percentiles
| (% days) | (days) | Max | 99th | 98th | 95th | 90th | 75th | 50th | |
|---|---|---|---|---|---|---|---|---|---|
| 2020 | 95.08 | 0 | 51.5 | 34.76 | 32.54 | 31.46 | 29.10 | 23.52 | 17.10 |
| 2019 | 94.25 | 0 | 42.4 | 37.30 | 34.67 | 31.88 | 29.71 | 24.80 | 19.05 |
| 2018 | 96.71 | 0 | 50.0 | 39.48 | 36.00 | 33.40 | 31.00 | 26.00 | 20.00 |
| 2017 | 92.60 | 0 | 57.0 | 38.26 | 36.00 | 33.00 | 31.00 | 27.00 | 20.00 |
| 2016 | 91.53 | 0 | 43.0 | 37.66 | 36.00 | 31.00 | 28.60 | 23.00 | 18.00 |
Table 44: Footscray nitrogen dioxide percentiles
| (% days) | (days) | Max | 99th | 98th | 95th | 90th | 75th | 50th | |
|---|---|---|---|---|---|---|---|---|---|
| 2020 | 97.81 | 0 | 64.8 | 39.53 | 37.84 | 35.23 | 32.43 | 26.67 | 19.20 |
| 2019 | 97.81 | 0 | 49.1 | 43.52 | 41.64 | 36.70 | 32.54 | 27.90 | 21.70 |
| 2018 | 98.63 | 0 | 46.0 | 40.64 | 38.00 | 35.05 | 32.00 | 27.00 | 21.00 |
| 2017 | 92.88 | 0 | 50.0 | 47.24 | 42.48 | 39.00 | 35.20 | 29.00 | 23.00 |
| 2016 | 95.08 | 0 | 52.0 | 41.24 | 37.81 | 35.00 | 32.33 | 25.63 | 20.05 |
Table 45: Geelong South nitrogen dioxide percentiles
| (% days) | (days) | Max | 99th | 98th | 95th | 90th | 75th | 50th | |
|---|---|---|---|---|---|---|---|---|---|
| 2020 | 93.44 | 0 | 52.8 | 41.79 | 35.12 | 28.40 | 25.99 | 21.17 | 13.85 |
| 2019 | 95.62 | 0 | 38.2 | 34.51 | 31.34 | 29.04 | 25.30 | 21.20 | 13.90 |
| 2018 | 88.22 | 0 | 51.0 | 37.58 | 34.00 | 29.95 | 26.00 | 19.00 | 14.00 |
| 2017 | 94.79 | 0 | 42.0 | 37.75 | 34.00 | 30.00 | 27.00 | 21.00 | 15.00 |
| 2016 | 95.63 | 0 | 44.1 | 36.60 | 30.95 | 28.17 | 25.03 | 20.60 | 14.00 |
Table 46: Traralgon nitrogen dioxide percentiles
| (% days) | (days) | Max | 99th | 98th | 95th | 90th | 75th | 50th | |
|---|---|---|---|---|---|---|---|---|---|
| 2020 | 92.90 | 0 | 32.0 | 27.86 | 26.84 | 25.01 | 22.90 | 18.45 | 12.65 |
| 2019 | 87.67 | 0 | 34.7 | 33.58 | 31.57 | 28.71 | 24.61 | 19.83 | 14.05 |
| 2018 | 96.99 | 0 | 53.0 | 31.00 | 30.00 | 27.00 | 25.00 | 20.00 | 12.00 |
| 2017 | 90.68 | 0 | 34.0 | 31.00 | 30.00 | 27.00 | 24.00 | 20.00 | 13.00 |
| 2016 | 86.61 | 0 | 36.0 | 32.84 | 30.00 | 27.00 | 24.00 | 20.00 | 14.00 |
4.6 Ozone (O3)
Overall trends in ozone concentrations as shown in Tables 47 to 60 are generally consistent from year to year, however there can be significant variation in the number of exceedances and higher percentiles, depending on pollution events during the year. The number of exceedances and higher percentiles are greater for years where there are significant bushfires like those experienced in 2020. This is due to the emissions of chemicals in smoke which can lead to the formation of ozone. The hotter conditions typically associated with major bushfires are also more conducive to ozone formation.
Table 47: Alphington ozone percentiles
| (% days) | (days) | Max | 99th | 98th | 95th | 90th | 75th | 50th | |
|---|---|---|---|---|---|---|---|---|---|
| 2020 | 94.81 | 1 | 129.2 | 74.13 | 65.40 | 47.24 | 37.76 | 30.75 | 25.90 |
| 2019 | 97.53 | 1 | 109.4 | 69.27 | 58.15 | 52.47 | 43.40 | 31.72 | 26.85 |
| 2018 | 97.81 | 0 | 80.9 | 59.00 | 54.88 | 49.00 | 43.00 | 32.10 | 28.00 |
| 2017 | 85.75 | 0 | 73.0 | 60.88 | 57.00 | 50.00 | 40.00 | 30.00 | 25.00 |
| 2016 | 96.45 | 0 | 66.0 | 58.48 | 53.96 | 47.40 | 37.00 | 28.00 | 22.00 |
Table 48: Dandenong ozone percentiles
| (% days) | (days) | Max | 99th | 98th | 95th | 90th | 75th | 50th | |
|---|---|---|---|---|---|---|---|---|---|
| 2020 | 98.09 | 1 | 110.9 | 74.79 | 55.29 | 43.11 | 36.74 | 30.50 | 26.4 |
| 2019 | 95.62 | 1 | 109.7 | 68.92 | 59.60 | 50.76 | 43.70 | 30.90 | 26.7 |
| 2018 | 97.26 | 0 | 93.6 | 59.92 | 51.92 | 45.30 | 41.00 | 31.65 | 27.0 |
| 2017 | 46.85 | 0 | 69.0 | 66.60 | 61.60 | 58.00 | 53.00 | 41.50 | 31.0 |
| 2016 | 41.80 | 0 | 60.0 | 58.14 | 56.96 | 53.40 | 46.00 | 36.00 | 26.3 |
Table 49: Footscray ozone percentiles
| (% days) | (days) | Max | 99th | 98th | 95th | 90th | 75th | 50th | |
|---|---|---|---|---|---|---|---|---|---|
| 2020 | 98.09 | 2 | 117.1 | 72.78 | 62.64 | 43.73 | 35.52 | 29.15 | 25.70 |
| 2019 | 91.23 | 0 | 87.8 | 67.70 | 60.72 | 50.28 | 42.48 | 30.90 | 26.00 |
| 2018 | 49.86 | 0 | 88.8 | 70.14 | 62.52 | 52.19 | 47.90 | 38.00 | 30.00 |
| 2017 | 98.08 | 0 | 79.0 | 63.00 | 56.72 | 51.00 | 43.30 | 31.00 | 27.00 |
| 2016 | 64.48 | 0 | 65.3 | 55.26 | 52.40 | 44.23 | 40.05 | 30.30 | 23.55 |
Table 50: Geelong South ozone percentiles
| (% days) | (days) | Max | 99th | 98th | 95th | 90th | 75th | 50th | |
|---|---|---|---|---|---|---|---|---|---|
| 2020 | 93.72 | 1 | 113.9 | 73.96 | 51.87 | 44.40 | 35.0 | 29.90 | 27.1 |
| 2019 | 96.16 | 0 | 75.8 | 64.15 | 59.30 | 49.10 | 38.3 | 30.40 | 26.9 |
| 2018 | 86.58 | 0 | 69.0 | 61.25 | 51.40 | 45.50 | 39.0 | 31.23 | 28.0 |
| 2017 | 97.26 | 0 | 67.0 | 58.00 | 56.92 | 48.00 | 42.0 | 32.00 | 29.0 |
| 2016 | 98.09 | 0 | 56.0 | 52.13 | 47.84 | 42.82 | 35.2 | 28.30 | 25.4 |
Table 51: Melton ozone percentiles
| (% days) | (days) | Max | 99th | 98th | 95th | 90th | 75th | 50th | |
|---|---|---|---|---|---|---|---|---|---|
| 2020 | 95.08 | 2 | 128.3 | 74.42 | 62.75 | 46.62 | 38.48 | 32.12 | 28.7 |
| 2019 | 96.99 | 0 | 76.3 | 69.62 | 64.28 | 51.51 | 47.47 | 34.38 | 29.6 |
| 2018 | 98.63 | 0 | 85.0 | 63.23 | 55.82 | 48.16 | 41.80 | 34.00 | 30.0 |
| 2017 | 44.38 | 0 | 73.0 | 70.39 | 68.00 | 63.95 | 55.00 | 46.00 | 33.0 |
| 2016 | 48.36 | 0 | 70.0 | 62.20 | 58.48 | 52.00 | 46.00 | 38.00 | 28.0 |
Table 52: Point Cook ozone percentiles
| (% days) | (days) | Max | 99th | 98th | 95th | 90th | 75th | 50th | |
|---|---|---|---|---|---|---|---|---|---|
| 2020 | 59.56 | 0 | 55.6 | 49.96 | 46.97 | 41.32 | 35.96 | 32.08 | 29.8 |
| 2019 | 75.62 | 0 | 67.3 | 65.17 | 63.05 | 53.12 | 44.10 | 32.20 | 28.7 |
| 2018 | 98.08 | 0 | 81.7 | 66.00 | 57.00 | 48.00 | 41.00 | 33.00 | 30.0 |
| 2017 | 46.58 | 0 | 80.0 | 66.41 | 62.24 | 57.55 | 52.00 | 41.00 | 29.0 |
| 2016 | 54.64 | 0 | 66.0 | 61.04 | 59.00 | 49.10 | 43.10 | 33.00 | 26.0 |
Table 53: Traralgon ozone percentiles
| (% days) | (days) | Max | 99th | 98th | 95th | 90th | 75th | 50th | |
|---|---|---|---|---|---|---|---|---|---|
| 2020 | 89.89 | 1 | 107.5 | 70.79 | 56.07 | 40.94 | 35.80 | 29.80 | 25.50 |
| 2019 | 95.34 | 0 | 88.9 | 66.16 | 60.25 | 51.96 | 43.03 | 30.90 | 26.55 |
| 2018 | 50.96 | 0 | 67.0 | 54.45 | 52.86 | 47.67 | 42.00 | 33.88 | 27.20 |
| 2017 | 97.81 | 0 | 64.0 | 52.44 | 48.88 | 43.00 | 38.00 | 30.00 | 26.00 |
| 2016 | 90.16 | 0 | 63.0 | 50.97 | 43.42 | 38.00 | 33.00 | 28.00 | 25.00 |
Table 54: Alphington 4-hour ozone percentiles
| (% days) | (days) | Max | 99th | 98th | 95th | 90th | 75th | 50th | |
|---|---|---|---|---|---|---|---|---|---|
| 2020 | 92.90 | 1 | 119.15 | 71.57 | 59.18 | 43.09 | 36.14 | 29.41 | 24.89 |
| 2019 | 94.25 | 1 | 96.80 | 60.08 | 54.30 | 49.11 | 41.45 | 30.17 | 25.37 |
| 2018 | 95.62 | 0 | 75.75 | 54.04 | 50.59 | 45.23 | 38.80 | 30.78 | 26.50 |
| 2017 | 83.84 | 0 | 67.00 | 55.50 | 53.95 | 47.81 | 39.12 | 28.00 | 24.00 |
| 2016 | 94.54 | 0 | 58.25 | 51.94 | 50.30 | 43.75 | 35.12 | 26.75 | 21.67 |
Table 55: Dandenong 4-hour ozone percentiles
| (% days) | (days) | Max | 99th | 98th | 95th | 90th | 75th | 50th | |
|---|---|---|---|---|---|---|---|---|---|
| 2020 | 96.99 | 2 | 98.00 | 69.13 | 50.81 | 39.82 | 34.27 | 29.86 | 25.20 |
| 2019 | 94.52 | 1 | 102.33 | 59.68 | 56.94 | 48.83 | 42.11 | 29.90 | 25.33 |
| 2018 | 96.44 | 1 | 82.92 | 56.23 | 49.50 | 43.19 | 38.59 | 30.33 | 26.00 |
| 2017 | 46.03 | 0 | 64.00 | 59.00 | 57.25 | 53.75 | 50.90 | 38.54 | 29.38 |
| 2016 | 41.26 | 0 | 56.50 | 55.25 | 53.67 | 49.06 | 43.00 | 33.25 | 24.65 |
Table 56: Footscray 4-hour ozone percentiles
| (% days) | (days) | Max | 99th | 98th | 95th | 90th | 75th | 50th | |
|---|---|---|---|---|---|---|---|---|---|
| 2020 | 96.45 | 2 | 108.38 | 68.98 | 57.61 | 40.14 | 34.00 | 28.27 | 24.27 |
| 2019 | 84.66 | 0 | 77.50 | 60.53 | 55.75 | 47.88 | 40.24 | 29.22 | 24.65 |
| 2018 | 49.86 | 1 | 82.17 | 66.69 | 58.85 | 49.47 | 43.98 | 35.75 | 28.25 |
| 2017 | 96.44 | 0 | 67.00 | 58.35 | 50.75 | 45.86 | 39.93 | 29.75 | 25.75 |
| 2016 | 63.11 | 0 | 52.92 | 50.85 | 48.28 | 41.94 | 38.17 | 28.41 | 22.50 |
Table 57: Geelong South 4-hour ozone percentiles
| (% days) | (days) | Max | 99th | 98th | 95th | 90th | 75th | 50th | |
|---|---|---|---|---|---|---|---|---|---|
| 2020 | 93.44 | 2 | 95.50 | 63.42 | 48.29 | 40.60 | 33.67 | 28.95 | 25.89 |
| 2019 | 94.79 | 0 | 69.53 | 57.73 | 54.04 | 45.26 | 36.81 | 29.57 | 25.98 |
| 2018 | 84.38 | 0 | 67.25 | 50.44 | 47.75 | 41.63 | 35.83 | 30.69 | 27.12 |
| 2017 | 95.07 | 0 | 61.00 | 56.31 | 52.00 | 46.02 | 39.75 | 31.00 | 28.00 |
| 2016 | 97.54 | 0 | 51.02 | 47.22 | 44.16 | 38.16 | 32.32 | 27.25 | 24.27 |
Table 58: Melton 4-hour ozone percentiles
| (% days) | (days) | Max | 99th | 98th | 95th | 90th | 75th | 50th | |
|---|---|---|---|---|---|---|---|---|---|
| 2020 | 93.99 | 3 | 119.35 | 67.63 | 60.43 | 43.69 | 36.67 | 31.61 | 27.86 |
| 2019 | 96.16 | 0 | 66.25 | 59.66 | 57.27 | 49.50 | 43.63 | 32.73 | 28.72 |
| 2018 | 97.81 | 0 | 72.00 | 56.91 | 51.85 | 47.00 | 40.05 | 32.50 | 29.00 |
| 2017 | 44.38 | 0 | 66.50 | 64.17 | 61.70 | 59.06 | 51.65 | 43.62 | 31.75 |
| 2016 | 48.09 | 0 | 58.25 | 56.81 | 52.75 | 49.38 | 43.25 | 35.54 | 26.62 |
Table 59: Point Cook 4-hour ozone percentiles
| (% days) | (days) | Max | 99th | 98th | 95th | 90th | 75th | 50th | |
|---|---|---|---|---|---|---|---|---|---|
| 2020 | 59.29 | 0 | 50.55 | 46.30 | 43.44 | 38.78 | 34.58 | 31.38 | 29.02 |
| 2019 | 74.79 | 0 | 63.20 | 58.62 | 57.03 | 49.79 | 41.02 | 30.67 | 27.82 |
| 2018 | 97.26 | 0 | 71.10 | 61.61 | 53.78 | 44.08 | 38.40 | 32.00 | 28.50 |
| 2017 | 46.30 | 0 | 70.50 | 61.67 | 56.25 | 55.05 | 48.55 | 37.50 | 28.25 |
| 2016 | 54.37 | 0 | 57.00 | 56.76 | 55.06 | 46.00 | 40.35 | 32.12 | 25.50 |
Table 60: Traralgon 4-hour ozone percentiles
| (% days) | (days) | Max | 99th | 98th | 95th | 90th | 75th | 50th | |
|---|---|---|---|---|---|---|---|---|---|
| 2020 | 88.52 | 1 | 101.55 | 62.56 | 50.80 | 38.43 | 33.08 | 28.44 | 24.36 |
| 2019 | 94.79 | 0 | 75.50 | 61.29 | 55.68 | 48.59 | 38.88 | 28.96 | 24.76 |
| 2018 | 50.96 | 0 | 61.25 | 51.98 | 50.27 | 41.73 | 39.12 | 31.56 | 25.62 |
| 2017 | 97.81 | 0 | 55.50 | 48.57 | 44.97 | 40.35 | 35.25 | 28.67 | 24.75 |
| 2016 | 89.89 | 0 | 58.70 | 47.18 | 40.80 | 35.40 | 30.80 | 27.00 | 23.50 |
4.7 Sulfur dioxide (SO2)
Overall trends in sulfur dioxide as shown in Tables 61 to 68 are generally consistent from year to year, with most NEPM stations recording values close to the instruments’ limit of detection. Stations such as Altona North, Geelong South and Traralgon are situated near major industrial sources, and show that there is ongoing variation in sulfur dioxide concentrations between years.
Table 61: Alphington sulfur dioxide percentiles
| (% days) | (days) | Max | 99th | 98th | 95th | 90th | 75th | 50th | |
|---|---|---|---|---|---|---|---|---|---|
| 2020 | 84.70 | 0 | 5.3 | 4.39 | 3.85 | 2.76 | 2.20 | 1.4 | 0.8 |
| 2019 | 90.14 | 0 | 10.2 | 6.17 | 5.38 | 3.96 | 3.22 | 2.1 | 1.2 |
| 2018 | 96.99 | 0 | 13.0 | 7.19 | 6.94 | 5.00 | 3.00 | 2.0 | 1.0 |
| 2017 | 95.62 | 0 | 11.0 | 6.00 | 5.04 | 5.00 | 4.00 | 2.0 | 1.0 |
| 2016 | 91.80 | 0 | 9.0 | 7.65 | 7.00 | 5.00 | 4.00 | 2.0 | 1.0 |
Table 62: Altona sulfur dioxide percentiles
| (% days) | (days) | Max | 99th | 98th | 95th | 90th | 75th | 50th | |
|---|---|---|---|---|---|---|---|---|---|
| 2020 | 23.22 | 0 | 43.6 | 41.08 | 32.98 | 26.80 | 19.58 | 8.70 | 3.9 |
| 2019 | 47.95 | 0 | 35.1 | 30.14 | 28.30 | 25.23 | 20.84 | 10.65 | 4.3 |
| 2018 | 84.93 | 0 | 53.0 | 36.82 | 34.00 | 28.55 | 19.00 | 11.00 | 4.0 |
| 2017 | 94.79 | 0 | 49.0 | 37.75 | 34.00 | 25.00 | 18.50 | 10.00 | 4.0 |
| 2016 | 92.62 | 0 | 44.0 | 38.00 | 32.00 | 24.00 | 19.00 | 7.50 | 3.0 |
Table 63: Geelong South sulfur dioxide percentiles
| (% days) | (days) | Max | 99th | 98th | 95th | 90th | 75th | 50th | |
|---|---|---|---|---|---|---|---|---|---|
| 2020 | 80.60 | 0 | 27.4 | 14.22 | 8.52 | 4.45 | 3.26 | 1.5 | 0.6 |
| 2019 | 94.25 | 0 | 47.1 | 26.54 | 17.80 | 9.85 | 5.54 | 2.2 | 0.7 |
| 2018 | 89.86 | 0 | 29.0 | 12.46 | 9.14 | 7.00 | 5.00 | 2.0 | 1.0 |
| 2017 | 94.52 | 0 | 17.0 | 10.56 | 8.00 | 5.00 | 3.00 | 2.0 | 1.0 |
| 2016 | 79.23 | 0 | 10.1 | 7.11 | 6.44 | 5.30 | 4.12 | 2.3 | 1.0 |
Table 64: Traralgon sulfur dioxide percentiles
| (% days) | (days) | Max | 99th | 98th | 95th | 90th | 75th | 50th | |
|---|---|---|---|---|---|---|---|---|---|
| 2020 | 91.26 | 0 | 30.8 | 19.21 | 14.64 | 9.47 | 6.84 | 3.6 | 1.75 |
| 2019 | 93.15 | 0 | 49.9 | 30.47 | 26.32 | 15.24 | 8.71 | 5.2 | 2.80 |
| 2018 | 89.59 | 0 | 79.0 | 38.74 | 21.86 | 14.00 | 10.00 | 4.0 | 2.00 |
| 2017 | 94.79 | 0 | 63.0 | 35.60 | 22.20 | 11.75 | 9.00 | 6.0 | 3.00 |
| 2016 | 88.25 | 0 | 57.0 | 22.78 | 17.12 | 13.72 | 10.00 | 6.0 | 3.00 |
Table 65: Alphington daily sulfur dioxide percentiles
| (% days) | (days) | Max | 99th | 98th | 95th | 90th | 75th | 50th | |
|---|---|---|---|---|---|---|---|---|---|
| 2020 | 84.70 | 0 | 2.45 | 2.01 | 1.51 | 1.13 | 0.86 | 0.57 | 0.33 |
| 2019 | 90.14 | 0 | 2.10 | 1.79 | 1.46 | 1.21 | 0.99 | 0.64 | 0.37 |
| 2018 | 96.99 | 0 | 3.74 | 1.90 | 1.52 | 1.23 | 1.00 | 0.57 | 0.30 |
| 2017 | 95.62 | 0 | 2.57 | 1.79 | 1.52 | 1.22 | 1.00 | 0.57 | 0.30 |
| 2016 | 91.80 | 0 | 2.26 | 1.72 | 1.63 | 1.14 | 0.93 | 0.57 | 0.26 |
Table 66: Altona daily sulfur dioxide percentiles
| (% days) | (days) | Max | 99th | 98th | 95th | 90th | 75th | 50th | |
|---|---|---|---|---|---|---|---|---|---|
| 2020 | 23.22 | 0 | 9.61 | 9.40 | 8.02 | 6.48 | 4.56 | 2.43 | 1.25 |
| 2019 | 47.95 | 0 | 7.76 | 7.09 | 6.31 | 4.55 | 3.01 | 1.88 | 1.10 |
| 2018 | 84.93 | 0 | 14.91 | 9.39 | 8.76 | 5.42 | 3.17 | 1.86 | 1.02 |
| 2017 | 94.79 | 0 | 13.65 | 8.24 | 7.10 | 4.51 | 3.41 | 1.91 | 1.00 |
| 2016 | 92.62 | 0 | 13.04 | 7.94 | 6.21 | 4.00 | 3.05 | 1.54 | 0.74 |
Table 67: Geelong South daily sulfur dioxide percentiles
| (% days) | (days) | Max | 99th | 98th | 95th | 90th | 75th | 50th | |
|---|---|---|---|---|---|---|---|---|---|
| 2020 | 80.60 | 0 | 2.64 | 1.70 | 1.34 | 1.06 | 0.84 | 0.50 | 0.28 |
| 2019 | 94.25 | 0 | 5.09 | 3.00 | 2.36 | 1.58 | 1.02 | 0.57 | 0.21 |
| 2018 | 89.86 | 0 | 3.48 | 2.27 | 2.04 | 1.55 | 1.11 | 0.69 | 0.27 |
| 2017 | 94.52 | 0 | 2.30 | 1.81 | 1.57 | 1.17 | 0.91 | 0.61 | 0.17 |
| 2016 | 79.23 | 0 | 1.99 | 1.93 | 1.64 | 1.41 | 0.87 | 0.59 | 0.26 |
Table 68: Traralgon daily sulfur dioxide percentiles
| (% days) | (days) | Max | 99th | 98th | 95th | 90th | 75th | 50th | |
|---|---|---|---|---|---|---|---|---|---|
| 2020 | 91.26 | 0 | 5.56 | 3.23 | 2.33 | 2.03 | 1.47 | 0.94 | 0.56 |
| 2019 | 93.15 | 0 | 8.44 | 4.25 | 3.19 | 2.59 | 1.85 | 1.20 | 0.64 |
| 2018 | 89.59 | 0 | 9.57 | 4.66 | 3.02 | 2.12 | 1.61 | 0.98 | 0.48 |
| 2017 | 94.79 | 0 | 15.09 | 6.05 | 3.63 | 2.47 | 2.04 | 1.35 | 0.65 |
| 2016 | 88.25 | 0 | 6.35 | 4.72 | 4.03 | 2.90 | 2.26 | 1.39 | 0.87 |
