


Victoria’s air monitoring plan for the assessment of air quality against the Measure was first approved in February 2001 by national, state and territory ministers on the National Environment Protection Council. Data presented in this report have been produced in accordance with the monitoring plan, with exceptions noted where required.
1.1 Monitoring stations
The Measure requires EPA to monitor the pollutants: carbon monoxide (CO), nitrogen dioxide (NO2), ozone (O3), sulfur dioxide (SO2), particles less than 10 micrometres (μm) in diameter (PM10), and particles less than 2.5 μm in diameter (PM2.5). EPA no longer monitors for lead, as ambient concentrations in Victoria have decreased significantly, due to the phase out of leaded petrol.
Eight regions are defined in Victoria’s air monitoring plan. These are:
- Port Phillip and Latrobe Valley regions, which have Measure-compliant monitoring stations
- Ballarat, Bendigo, Shepparton, Warrnambool and Mildura, where campaign monitoring was previously conducted
- Wodonga, where data from monitoring at Albury, New South Wales was used.
EPA’s 2020 Measure-compliant monitoring stations are shown in Figure 1 and Figure 2. The monitoring stations, pollutants monitored, and site types are summarised in Table 1. Site types are defined in the Measure as ‘generally representative upper bound for community exposure’ and ‘population-average sites’. EPA also has trend stations which provide data on the long-term trends in air pollution over many years. The types of communities covered by each monitoring station (known as the ‘exposed population’) is described in the ‘location category’ column in Table 1.
Figure 1: Defined regions and population density in Victoria
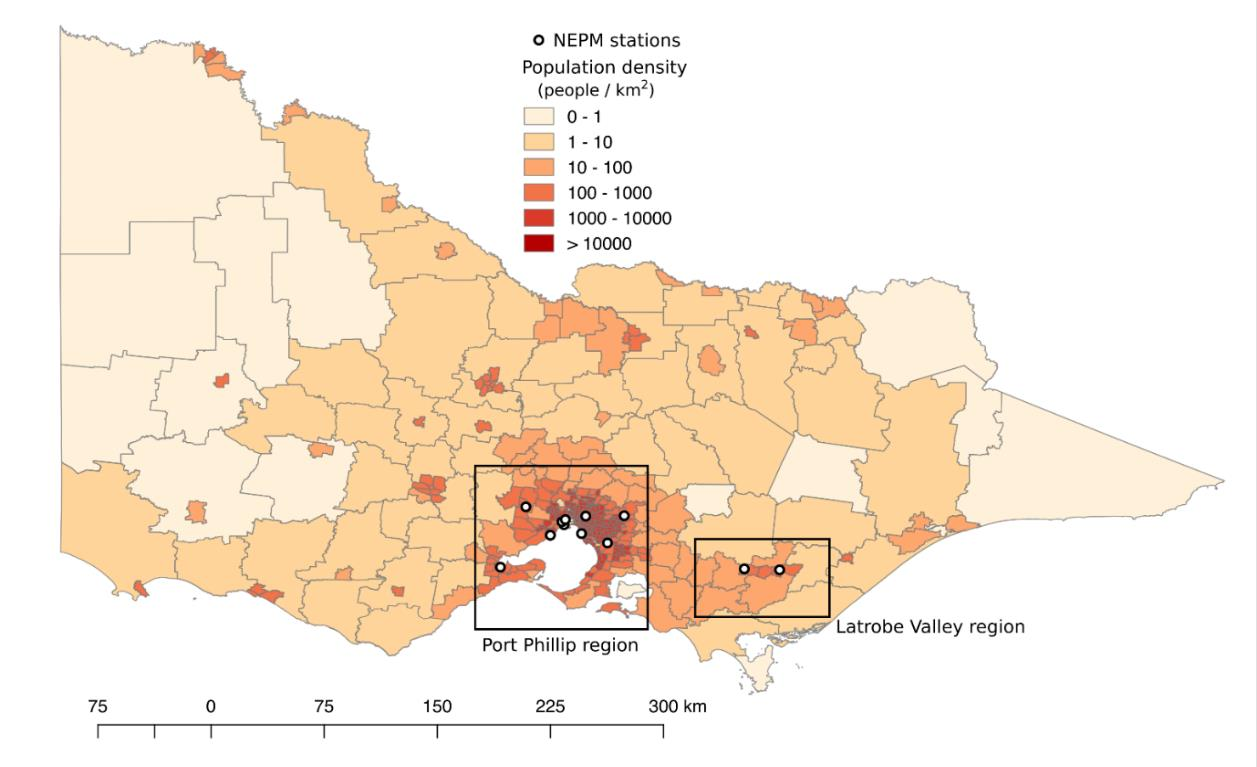
Figure 2: Defined regions and population density in Port Phillip region
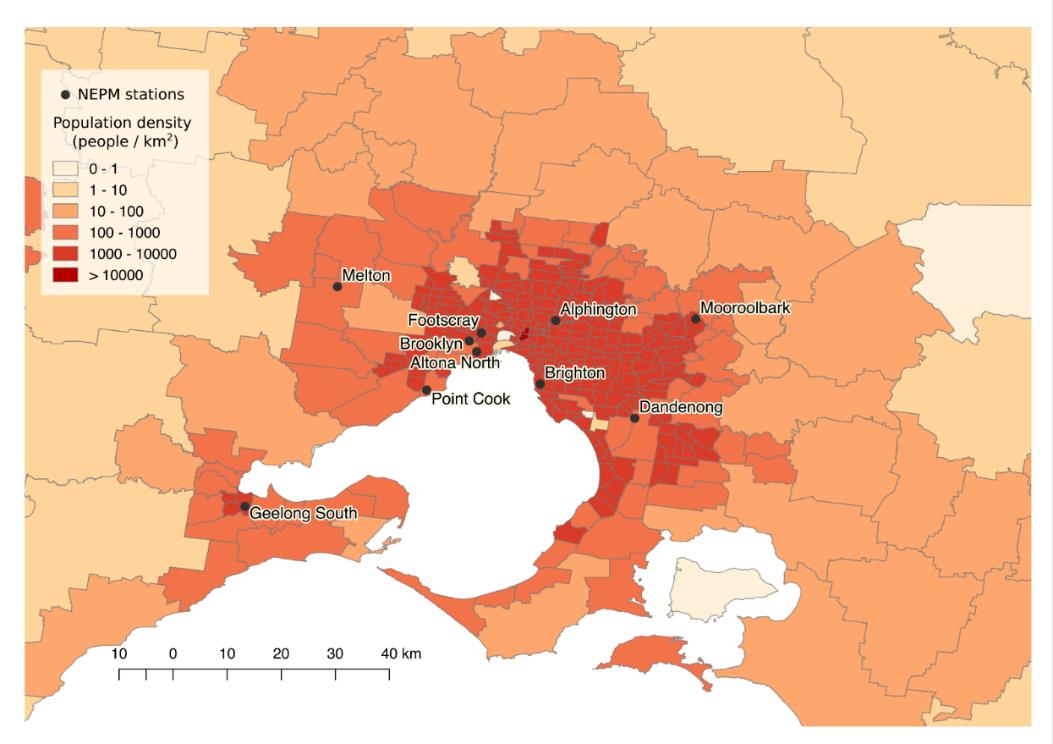
Table 1: EPA NEPM monitoring stations and parameters
| Monitoring station | Region | Location category | CO | NO2 | O3 | SO2 | PM10 | PM2.5 |
|---|---|---|---|---|---|---|---|---|
| Alphington | Melbourne East | Residential | G* | G* | Pop | Pop | G* | G* |
| Altona North | Melbourne West | Industrial/ residential | G* | |||||
| Dandenong | Melbourne East | Industrial | Pop* | Pop | ||||
| Footscray | Melbourne West | Residential | G* | G* | G* | G* | ||
| Geelong South | Geelong | Industrial/ residential | G* | G* | Pop* | G* | G* | G* |
| Melbourne CBD | Melbourne CBD | Commercial/ residential | G | |||||
| Melton | Melbourne West | Residential | G | |||||
| Mooroolbark | Melbourne East | Residential | Pop | Pop | ||||
| Point Cook | Melbourne West | Residential | Pop* | G* | ||||
| Traralgon | Latrobe Valley | Residential | G* | G* | G* | G* | G* | |
| Note: | ||||||||
| * Trend station (use to determine long term trends in air quality | ||||||||
| 1 G Generally representative upper bound | ||||||||
| a Pop Population average |
1.1.1 Implementation of the monitoring plan
EPA continually evaluates Victoria’s air quality monitoring program to determine which sites and pollutants need to be monitored. Stations are located and set up according to the Australian Standards (Table 2). Generally, EPA’s air monitoring stations have remained stable over the years, although changes to the network are made as needed. Recent changes include:
- A PM2.5 monitoring station was established in the Melbourne CBD in 2017.
- A PM2.5 monitoring station was established in Bendigo in 2020. Data from this station are not included in this report as it is a campaign station. Data from this station are available on EPA AirWatch.
- A PM2.5 monitoring station was established in Campbellfield in 2020. Data from this station are not included in this report as it is a campaign station. Data from this station are available on EPA AirWatch.
- In mid-2019, the Altona monitoring station was temporarily shut down pending relocation to another site, a new site was established at a nearby location in late 2020.
1.1.2 Screening procedure
Victoria’s air monitoring plan outlines how EPA may use screening procedures to demonstrate whether concentrations of pollutants are consistently below the standards in the Measure. If these screening procedures are satisfied, monitoring may not be required, or may be conducted at fewer locations. Screening procedures conducted in accordance with the Measure have been satisfied a number of for Victorian regions. EPA did not monitor air quality at Ballarat, Shepparton, Warrnambool, Wodonga and Mildura in 2020 as previous monitoring campaigns in these areas showed that pollutant levels were expected to be consistently below the relevant standards.
1.2 Monitoring and reporting methods
Victorian monitoring is conducted in accordance with the Australian Standards as shown in Table 2 and Table 3. Data not meeting the requirements of these Standards and EPA’s quality assurance procedures were identified as invalid and not included in this report. Tapered Element Oscillating Microbalance (TEOM) PM10 data included in this report have been adjusted according to the approved procedure outlined in Technical Paper No. 10 – Collection and Reporting of TEOM PM10 Data 5, using the temperature dependent formula with a constant value of K equal to 0.04. The resulting adjustments vary from no change at daily average temperatures at or above 15°C, to an increase of 40% at a temperature of 5°C. Particle concentration units of μg/m3 refer to volumes at 0°C and one atmosphere of pressure.
1.2.1 NATA status
As of February 2016, EPA outsourced monitoring for PM10 and PM2.5 using the Hivol and Partisol gravimetric methods to Golder Associates (NATA accreditation Number 1910). All other methods currently used by EPA for performance monitoring are covered by its National Association of Testing Authorities (NATA) accreditation (Number 15119) except for PM2.5 using Beta Attenuation Monitors (BAMs). EPA was reaccredited by NATA in 2020. EPA is working to incorporate monitoring for PM2.5 using BAMs as part of its NATA accreditation. The method is in use and all technical elements have been completed, and is due to be assessed at an upcoming NATA audit. Table 2 shows compliance with AS/NZS 3580.1.1:2016 for the siting and operation of each air monitoring station.
Table 2: EPA NEPM monitoring stations siting compliance with AS/NZS 3580.1.1–2016
| Monitoring station | Height above ground | Minimum distance to support structure | Clear sky angle of 120o | Unrestricted airflow of >270o | 20 m from trees | No nearby emission source | Minimum distance from road or traffic |
|---|---|---|---|---|---|---|---|
| Alphington | Y | Y | Y | Y | N | Y | N |
| Altona North | Y | Y | Y | Y | Y | Y | N |
| Dandenong | Y | Y | Y | Y | N | Y | N |
| Footscray | Y | Y | Y | Y | N | Y | N |
| Geelong South | Y | Y | Y | Y | N | Y | N |
| Melbourne CBD | Y | Y | Y | Y | N | Y | N |
| Melton | Y | Y | Y | Y | N | Y | N |
| Mooroolbark | Y | Y | Y | Y | N | Y | N |
| Point Cook | Y | Y | Y | Y | N | Y | N |
| Traralgon | Y | Y | Y | Y | N | Y | N |
Table 3: EPA NEPM monitoring methods
| Pollutant | Australian Standard | Measurement technique |
|---|---|---|
| Carbon monoxide (CO) | Australian Standard 3580.7.1 Ambient air - Determination of carbon monoxide, direct instrumental method | Gas filter correlation/infrared |
| Nitrogen dioxide (NO2) | Australian Standard 3580.5.1 Ambient air – Determination of oxides of nitrogen – Direct reading instrument method | Gas phase chemiluminescence |
| Photochemical oxidant (ozone) (O3) | Australia Standard 3580.6.1 Ambient air — Determination of ozone — Direct reading instrument method | Non-dispersive ultraviolet |
| Sulfur dioxide (SO2) | Australian Standard 3580.4.1 Ambient air – Determination of sulfur dioxide – Direct reading instrument method | Pulsed fluorescence |
| Particles less than 10µm (PM10) | Australian Standard 3580.9.8 Determination of suspended particulate matter – PM10 continuous direct mass method using a tapered element oscillating microbalance analyser | Tapered element oscillating microbalance (TEOM) |
| Particles less than 2.5µm (PM2.5) | Australian Standard 3580.9.12 Determination of suspended particulate matter PM2.5 beta attenuation monitors | Beta attenuation monitors (BAM) |
| Particles less than 2.5µm (PM2.5) | Australian Standard 3580.9.10 Determination of suspended particulate matter – PM2.5 low volume sampler – Gravimetric method | Gravimetric reference method |
Reviewed 21 September 2021
