


4.1 Particles (PM2.5)
Overall trends in PM2.5 are generally consistent however there is significant variation in the number of exceedances and higher percentiles depending on events during the year (Table 27 to 31). The number of exceedances and higher percentiles are greater for years were there are significant bushfires like those experienced in 2020. The higher number of exceedances and higher percentiles are not recorded for Alphington due to lack of data as a result of technical problems with the monitor.
Table 27: Alphington PM2.5 percentiles
| (% days) | (days) | Max | 99th | 98th | 95th | 90th | 75th | 50th | |
|---|---|---|---|---|---|---|---|---|---|
| 2020 | 76.50 | 7 | 35.66 | 27.89 | 25.94 | 19.05 | 13.52 | 9.01 | 6.37 |
| 2019 | 67.67 | 2 | 30.65 | 23.71 | 18.90 | 16.23 | 13.34 | 9.27 | 6.58 |
| 2018 | 87.40 | 8 | 42.01 | 29.68 | 27.23 | 17.46 | 13.36 | 8.79 | 6.52 |
| 2017 | 92.33 | 8 | 35.94 | 27.75 | 26.60 | 20.34 | 15.76 | 10.17 | 7.45+ |
| 2016 | 84.15 | 2 | 33.62 | 23.05 | 22.29 | 14.53 | 11.93 | 8.64 | 6.24 |
Table 28: Footscray PM2.5 percentiles
| (% days) | (days) | Max | 99th | 98th | 95th | 90th | 75th | 50th | |
|---|---|---|---|---|---|---|---|---|---|
| 2020 | 95.90 | 8 | 204.50 | 63.05 | 29.86 | 17.59 | 12.92 | 8.34 | 5.79 |
| 2019 | 98.08 | 4 | 31.30 | 23.83 | 20.43 | 15.06 | 12.01 | 8.66 | 6.65 |
| 2018 | 88.22 | 5 | 31.20 | 28.32 | 20.95 | 15.34 | 12.52 | 8.76 | 6.67 |
| 2017 | 96.44 | 4 | 34.77 | 24.51 | 20.72 | 15.53 | 13.06 | 9.25 | 6.75 |
| 2016 | 93.17 | 2 | 25.87 | 19.65 | 14.60 | 12.88 | 11.11 | 8.41 | 6.18 |
Table 29: Geelong South PM2.5 percentiles
| (% days) | (days) | Max | 99th | 98th | 95th | 90th | 75th | 50th | |
|---|---|---|---|---|---|---|---|---|---|
| 2020 | 86.07 | 6 | 155.05 | 66.48 | 23.39 | 15.01 | 11.71 | 7.78 | 5.50 |
| 2019 | 95.62 | 1 | 32.68 | 19.28 | 16.97 | 12.85 | 10.48 | 7.51 | 5.53 |
| 2018 | 86.58 | 1 | 31.03 | 21.87 | 18.43 | 13.66 | 10.16 | 7.70 | 5.57 |
| 2017 | 83.01 | 2 | 26.80 | 22.27 | 18.23 | 13.52 | 10.89 | 8.50 | 6.42 |
| 2016 | 36.34 | 0 | 13.53 | 11.98 | 10.66 | 9.69 | 8.41 | 6.72 | 5.24 |
Table 30: Melbourne CBD PM2.5 percentiles
| (% days) | (days) | Max | 99th | 98th | 95th | 90th | 75th | 50th | |
|---|---|---|---|---|---|---|---|---|---|
| 2020 | 96.99 | 10 | 196.31 | 69.19 | 26.92 | 18.54 | 12.81 | 7.67 | 5.28 |
| 2019 | 93.70 | 2 | 27.95 | 21.59 | 19.07 | 14.20 | 12.35 | 8.22 | 5.81 |
| 2018 | 94.79 | 7 | 42.14 | 32.43 | 23.97 | 17.07 | 12.79 | 9.07 | 6.81 |
| 2017 | 62.19 | 3 | 28.66 | 26.54 | 23.74 | 17.92 | 13.34 | 9.62 | 7.13 |
Table 31: Traralgon PM2.5 percentiles
| (% days) | (days) | Max | 99th | 98th | 95th | 90th | 75th | 50th | |
|---|---|---|---|---|---|---|---|---|---|
| 2020 | 89.07 | 5 | 236.00 | 31.42 | 23.29 | 18.49 | 14.49 | 9.94 | 6.74 |
| 2019 | 95.07 | 8 | 37.40 | 31.42 | 26.15 | 19.23 | 14.87 | 10.73 | 7.48 |
| 2018 | 87.12 | 2 | 30.08 | 23.21 | 22.26 | 17.75 | 13.39 | 9.66 | 6.86 |
| 2017 | 86.85 | 5 | 32.26 | 27.98 | 21.98 | 18.34 | 14.85 | 9.84 | 7.19 |
| 2016 | 94.81 | 1 | 25.69 | 22.89 | 20.64 | 15.63 | 12.47 | 9.31 | 6.91 |
4.2 Population exposure (PM2.5)
In order to estimate concentrations where there are no EPA air monitoring stations, modelled concentrations of PM2.5 are used. This has been carried out using the CSIRO Air Quality Forecasting (AQFx) system. The modelling results as shown in Figure 28 and Figure 29 show that the highest levels and impacts from the bushfires which occurred in eastern Victoria.
Figure 28: Modelled PM2.5 annual average concentration (µg/m3) for 2020
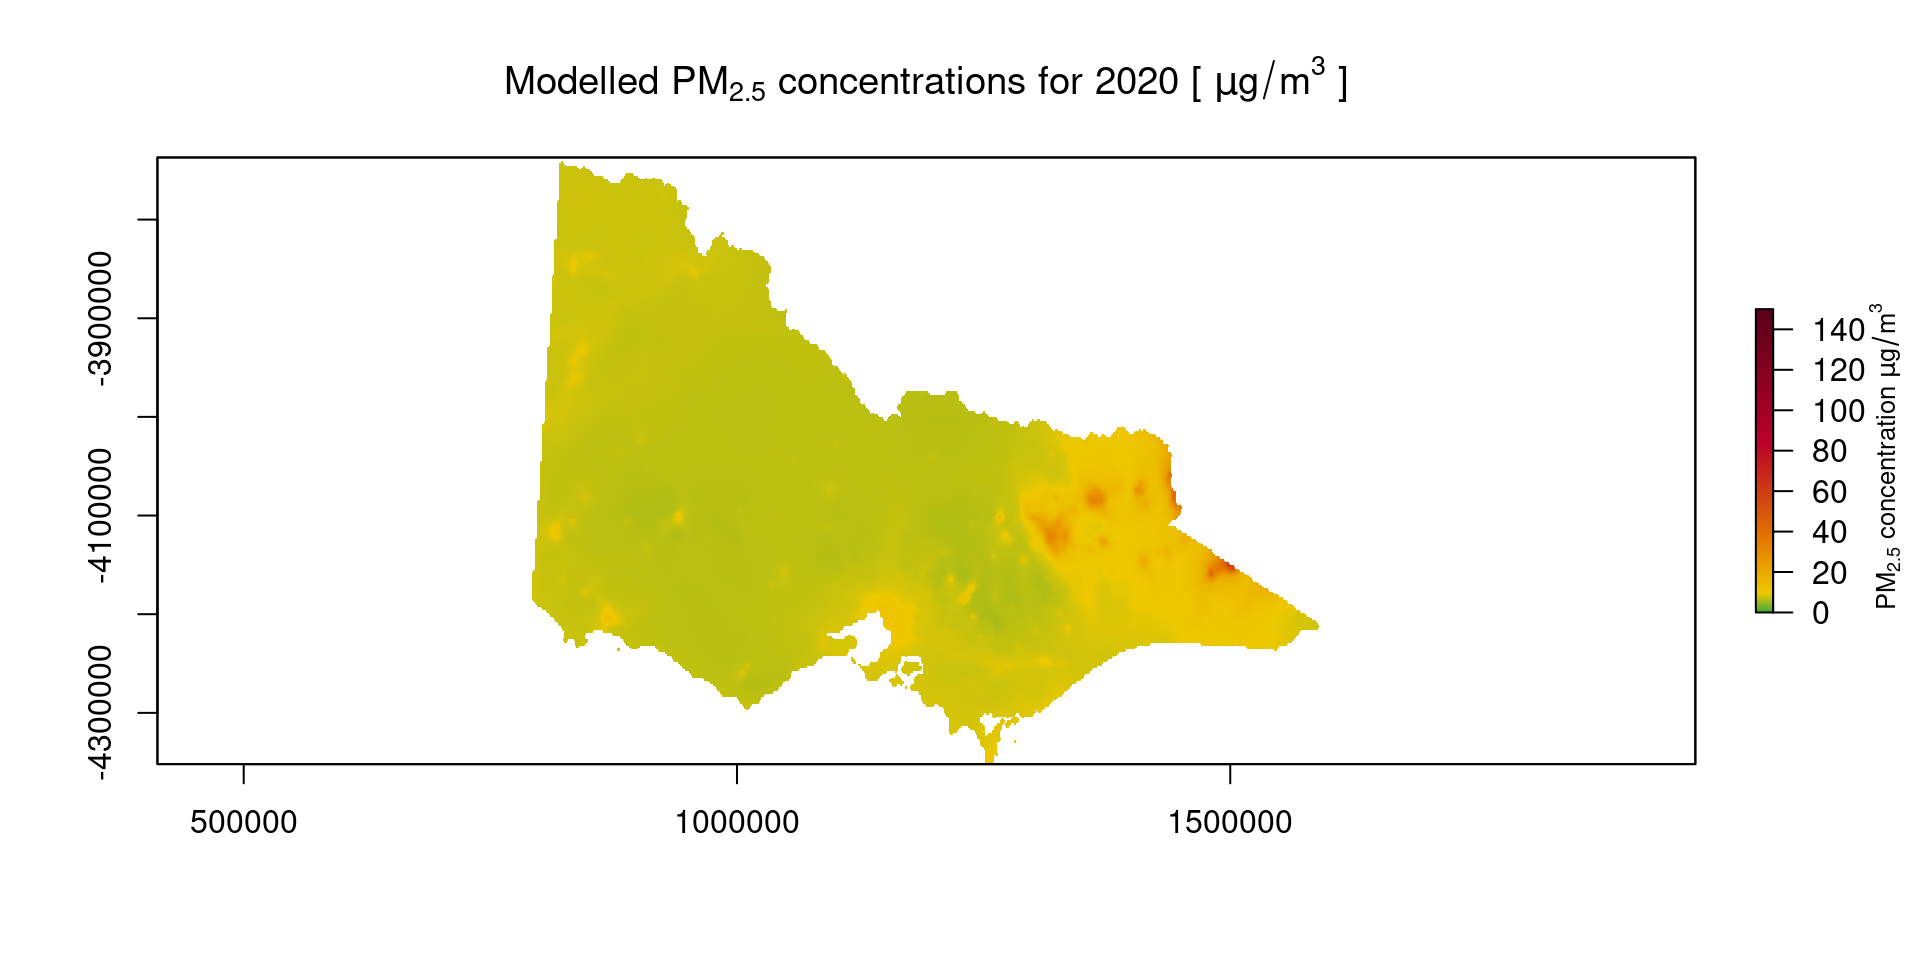
Figure 29: Modelled PM2.5 annual average concentration (µg/m3) for 2019
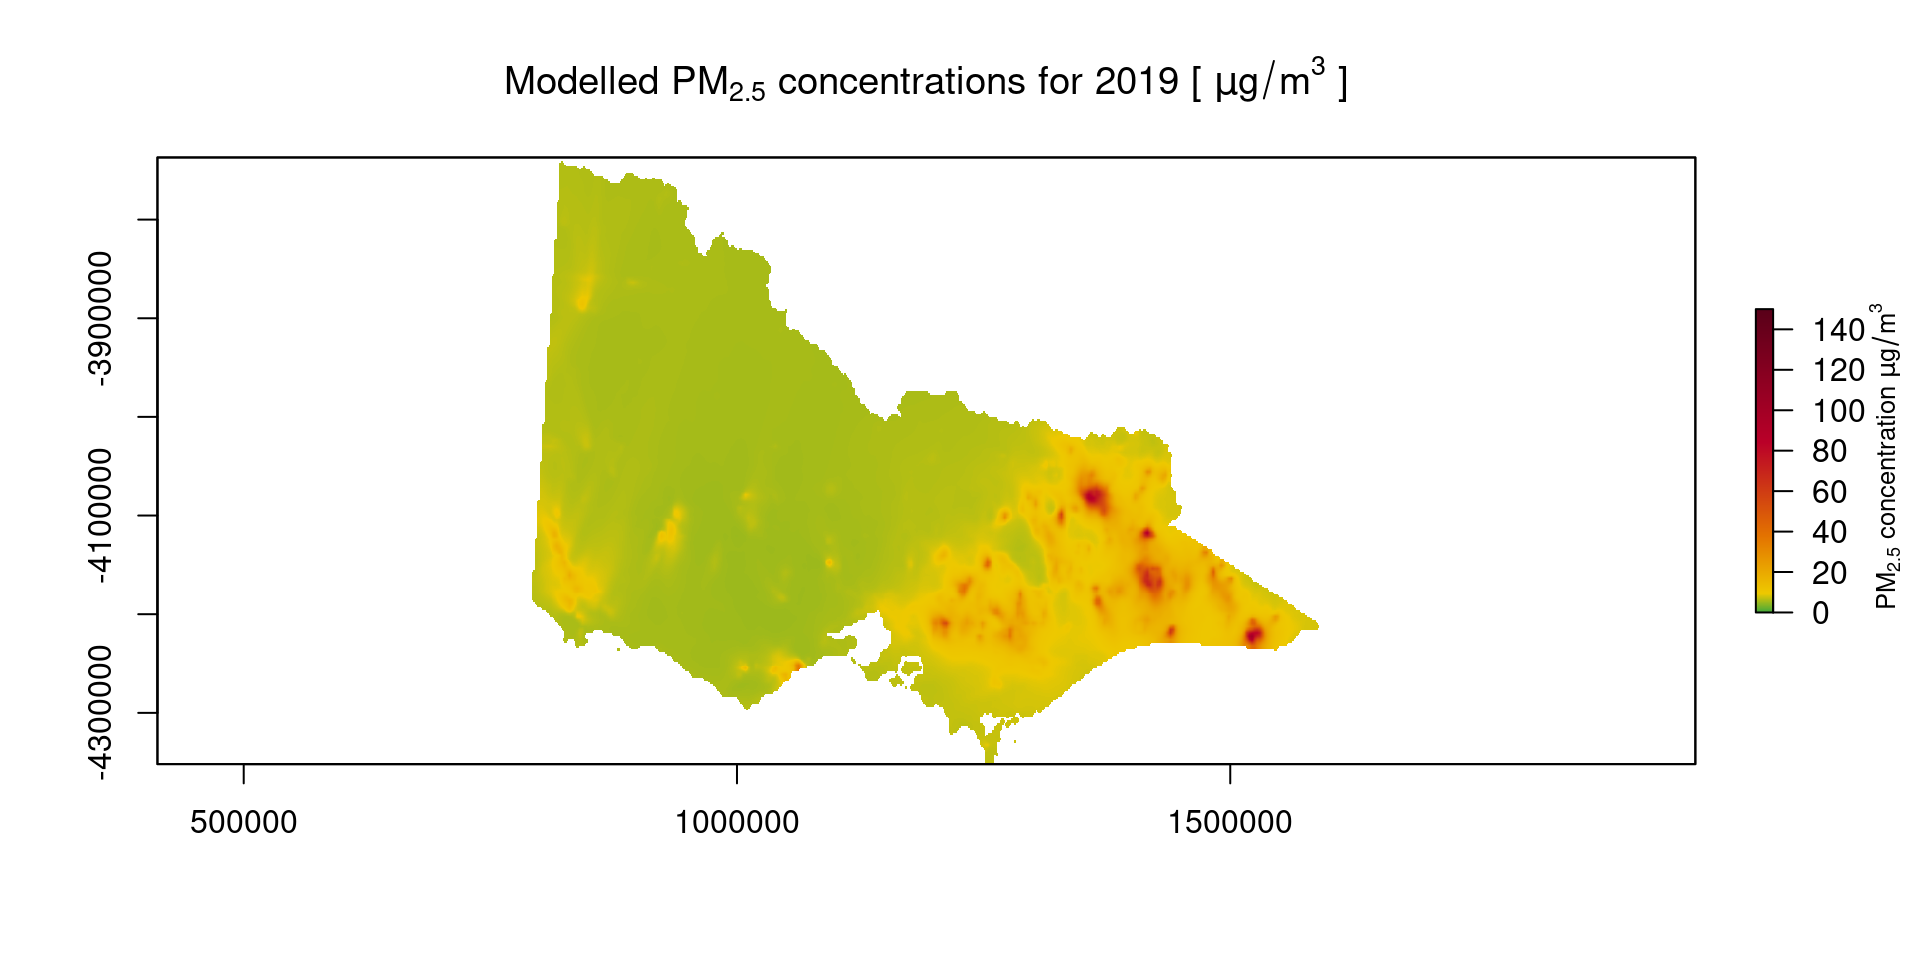
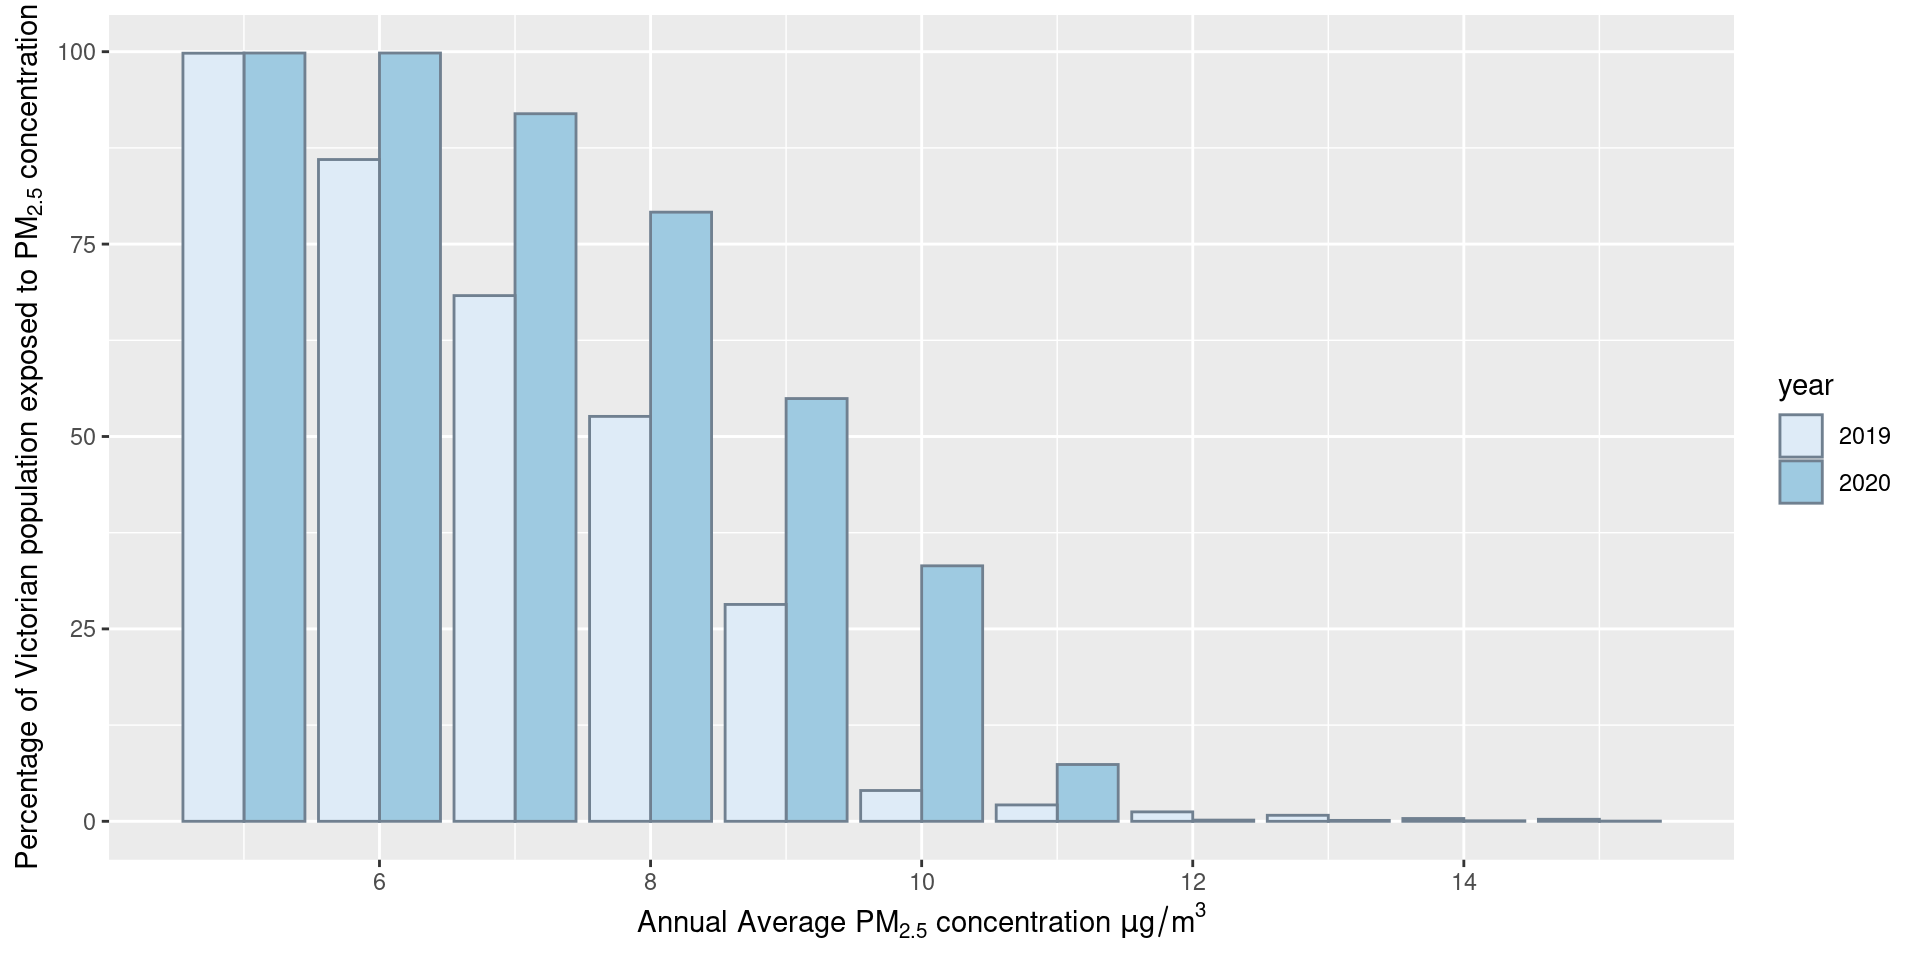
Table 32: Percentage of population exposed to PM2.5 concentrations (µg/m3)
| 5 | 6 | 7 | 8 | 9 | 10 | 11 | 12 | 13 | 14 | 15 | 20 | 25 | 30 | 35 | 40 | |
|---|---|---|---|---|---|---|---|---|---|---|---|---|---|---|---|---|
| 2020 | 99.829 | 99.829 | 91.942 | 79.151 | 54.932 | 33.198 | 7.382 | 0.158 | 0.121 | 0.071 | 0.028 | 0.006 | 0.003 | 0.001 | 0.001 | 0.000 |
| 2019 | 99.807 | 85.991 | 68.310 | 52.614 | 28.180 | 4.004 | 2.129 | 1.227 | 0.784 | 0.365 | 0.263 | 0.112 | 0.048 | 0.024 | 0.014 | 0.005 |
Figure 30
4.3 Particles (PM10)
Overall trends in PM10 as shown in Tables 33 to 38 are generally consistent from year to year, however there can be significant variation in the number of exceedances and higher percentiles depending on events during the year. The number of exceedances and higher percentiles are greater for years where there are significant bushfires like those experienced in 2020.
Table 33: Alphington PM10 percentiles
| (% days) | (days) | Max | 99th | 98th | 95th | 90th | 75th | 50th | |
|---|---|---|---|---|---|---|---|---|---|
| 2020 | 92.35 | 7 | 226.48 | 68.99 | 48.01 | 37.08 | 28.96 | 21.98 | 16.22 |
| 2019 | 95.34 | 5 | 69.81 | 55.26 | 45.29 | 37.27 | 31.98 | 23.08 | 16.80 |
| 2018 | 90.96 | 3 | 73.99 | 47.44 | 46.25 | 38.33 | 31.07 | 22.56 | 17.34 |
| 2017 | 95.89 | 0 | 41.08 | 32.51 | 31.22 | 27.27 | 24.09 | 20.00 | 15.83 |
| 2016 | 94.54 | 0 | 37.94 | 34.23 | 31.35 | 27.49 | 24.21 | 18.58 | 14.05 |
Table 34: Dandenong PM10 percentiles
| (% days) | (days) | Max | 99th | 98th | 95th | 90th | 75th | 50th | |
|---|---|---|---|---|---|---|---|---|---|
| 2020 | 91.26 | 9 | 259.12 | 87.27 | 62.22 | 37.08 | 29.81 | 23.21 | 17.57 |
| 2019 | 94.52 | 9 | 144.03 | 78.72 | 56.55 | 40.81 | 35.45 | 26.27 | 18.24 |
| 2018 | 95.89 | 3 | 89.74 | 47.63 | 40.59 | 33.51 | 28.95 | 24.08 | 17.37 |
| 2017 | 23.29 | 0 | 37.53 | 35.29 | 34.13 | 29.92 | 28.00 | 22.60 | 16.69 |
| 2016 | 72.13 | 0 | 41.78 | 38.86 | 34.65 | 31.81 | 27.27 | 20.69 | 14.47 |
Table 35: Footscray PM10 percentiles
| (% days) | (days) | Max | 99th | 98th | 95th | 90th | 75th | 50th | |
|---|---|---|---|---|---|---|---|---|---|
| 2020 | 87.43 | 1 | 50.95 | 36.12 | 35.46 | 31.24 | 25.93 | 20.96 | 15.45 |
| 2019 | 79.73 | 7 | 66.92 | 52.89 | 51.18 | 39.85 | 33.19 | 24.30 | 17.38 |
| 2018 | 95.89 | 1 | 58.77 | 46.15 | 42.31 | 35.06 | 29.54 | 23.44 | 17.19 |
| 2017 | 91.23 | 0 | 49.83 | 39.53 | 36.59 | 30.99 | 28.09 | 23.04 | 17.40 |
| 2016 | 94.26 | 0 | 42.66 | 37.88 | 35.11 | 30.05 | 25.97 | 20.24 | 14.18 |
Table 36: Geelong South PM10 percentiles
| (% days) | (days) | Max | 99th | 98th | 95th | 90th | 75th | 50th | |
|---|---|---|---|---|---|---|---|---|---|
| 2020 | 69.40 | 6 | 199.41 | 143.66 | 61.38 | 40.11 | 32.17 | 25.35 | 17.96 |
| 2019 | 88.49 | 11 | 101.51 | 70.42 | 63.85 | 45.75 | 36.86 | 24.16 | 17.20 |
| 2018 | 93.70 | 6 | 97.08 | 70.13 | 46.71 | 41.49 | 33.85 | 25.03 | 17.52 |
| 2017 | 81.10 | 3 | 73.73 | 44.33 | 39.57 | 32.41 | 29.61 | 22.82 | 16.43 |
| 2016 | 93.17 | 5 | 68.35 | 57.22 | 47.29 | 37.36 | 30.42 | 21.94 | 15.89 |
Table 37: Mooroolbark PM10 percentiles
| (% days) | (days) | Max | 99th | 98th | 95th | 90th | 75th | 50th | |
|---|---|---|---|---|---|---|---|---|---|
| 2020 | 89.07 | 4 | 76.06 | 51.00 | 38.43 | 31.01 | 23.41 | 18.40 | 13.91 |
| 2019 | 97.53 | 4 | 75.10 | 49.98 | 42.61 | 35.02 | 30.46 | 21.57 | 15.14 |
| 2018 | 95.62 | 1 | 111.25 | 34.65 | 33.69 | 29.16 | 25.31 | 20.22 | 15.24 |
| 2017 | 96.16 | 2 | 55.45 | 36.35 | 31.25 | 24.49 | 21.60 | 18.54 | 14.39 |
| 2016 | 95.36 | 0 | 44.68 | 32.48 | 29.70 | 26.33 | 22.49 | 17.43 | 12.53 |
Table 38: Traralgon PM10 percentiles
| (% days) | (days) | Max | 99th | 98th | 95th | 90th | 75th | 50th | |
|---|---|---|---|---|---|---|---|---|---|
| 2020 | 90.71 | 9 | 236.31 | 156.55 | 62.43 | 32.88 | 27.07 | 22.70 | 17.22 |
| 2019 | 95.07 | 5 | 77.99 | 52.84 | 46.31 | 35.91 | 29.42 | 22.88 | 16.70 |
| 2018 | 95.62 | 0 | 50.08 | 34.09 | 28.49 | 25.91 | 22.87 | 18.85 | 14.82 |
| 2017 | 91.78 | 0 | 42.83 | 32.17 | 28.44 | 24.57 | 21.75 | 17.98 | 14.70 |
| 2016 | 97.54 | 0 | 49.19 | 36.07 | 30.26 | 25.45 | 21.88 | 17.45 | 14.02 |
4.4 Carbon monoxide (CO)
Overall trends in carbon monoxide as shown in Tables 39 to 42 are generally consistent from year to year, however there can be significant variation in the number of exceedances and higher percentiles depending on events during the year. The number of exceedances and higher percentiles are greater for years where there are significant bushfires like those experienced in 2020.
Table39: Alphington 8-hour carbon monoxide percentiles
| (% days) | (days) | Max | 99th | 98th | 95th | 90th | 75th | 50th | |
|---|---|---|---|---|---|---|---|---|---|
| 2020 | 88.52 | 0 | 2.25 | 1.35 | 1.21 | 0.99 | 0.74 | 0.41 | 0.22 |
| 2019 | 86.03 | 0 | 1.17 | 0.84 | 0.73 | 0.61 | 0.47 | 0.35 | 0.23 |
| 2018 | 92.88 | 0 | 1.71 | 1.27 | 1.11 | 0.87 | 0.70 | 0.41 | 0.27 |
| 2017 | 93.15 | 0 | 1.49 | 1.37 | 1.24 | 1.12 | 0.88 | 0.43 | 0.31 |
| 2016 | 88.80 | 0 | 2.01 | 1.32 | 1.18 | 0.94 | 0.78 | 0.49 | 0.33 |
Table 40: Footscray 8-hour carbon monoxide percentiles
| (% days) | (days) | Max | 99th | 98th | 95th | 90th | 75th | 50th | |
|---|---|---|---|---|---|---|---|---|---|
| 2020 | 92.62 | 0 | 2.84 | 1.30 | 1.19 | 0.68 | 0.49 | 0.29 | 0.20 |
| 2019 | 85.21 | 0 | 1.11 | 0.67 | 0.60 | 0.47 | 0.36 | 0.26 | 0.18 |
| 2018 | 86.30 | 0 | 0.97 | 0.71 | 0.64 | 0.59 | 0.47 | 0.29 | 0.18 |
| 2017 | 91.23 | 0 | 1.11 | 0.91 | 0.81 | 0.60 | 0.47 | 0.30 | 0.19 |
| 2016 | 90.44 | 0 | 1.35 | 0.72 | 0.66 | 0.55 | 0.46 | 0.28 | 0.18 |
Table 41: Geelong South 8-hour carbon monoxide percentiles
| (% days) | (days) | Max | 99th | 98th | 95th | 90th | 75th | 50th | |
|---|---|---|---|---|---|---|---|---|---|
| 2020 | 87.98 | 0 | 3.04 | 1.55 | 0.87 | 0.62 | 0.47 | 0.26 | 0.19 |
| 2019 | 92.88 | 0 | 1.46 | 0.85 | 0.71 | 0.49 | 0.31 | 0.22 | 0.15 |
| 2018 | 81.92 | 0 | 1.07 | 0.81 | 0.73 | 0.58 | 0.44 | 0.26 | 0.18 |
| 2017 | 92.33 | 0 | 1.01 | 0.92 | 0.79 | 0.48 | 0.40 | 0.27 | 0.19 |
| 2016 | 86.34 | 0 | 1.72 | 0.84 | 0.80 | 0.59 | 0.38 | 0.25 | 0.17 |
Table 42: Traralgon 8-hour carbon monoxide percentiles
| (% days) | (days) | Max | 99th | 98th | 95th | 90th | 75th | 50th | |
|---|---|---|---|---|---|---|---|---|---|
| 2020 | 87.16 | 0 | 4.94 | 2.59 | 1.24 | 0.87 | 0.69 | 0.49 | 0.22 |
| 2019 | 90.14 | 0 | 1.19 | 0.96 | 0.87 | 0.62 | 0.54 | 0.35 | 0.21 |
| 2018 | 96.16 | 0 | 1.23 | 0.76 | 0.72 | 0.65 | 0.51 | 0.31 | 0.19 |
| 2017 | 88.77 | 0 | 1.14 | 0.91 | 0.84 | 0.77 | 0.61 | 0.37 | 0.24 |
| 2016 | 95.08 | 0 | 1.06 | 0.76 | 0.73 | 0.61 | 0.52 | 0.39 | 0.21 |
4.5 Nitrogen dioxide (NO2)
Overall trends in nitrogen dioxide concentrations as shown in Tables 43 to 46 are generally consistent from year to year.
Table 43: Alphington nitrogen dioxide percentiles
| (% days) | (days) | Max | 99th | 98th | 95th | 90th | 75th | 50th | |
|---|---|---|---|---|---|---|---|---|---|
| 2020 | 95.08 | 0 | 51.5 | 34.76 | 32.54 | 31.46 | 29.10 | 23.52 | 17.10 |
| 2019 | 94.25 | 0 | 42.4 | 37.30 | 34.67 | 31.88 | 29.71 | 24.80 | 19.05 |
| 2018 | 96.71 | 0 | 50.0 | 39.48 | 36.00 | 33.40 | 31.00 | 26.00 | 20.00 |
| 2017 | 92.60 | 0 | 57.0 | 38.26 | 36.00 | 33.00 | 31.00 | 27.00 | 20.00 |
| 2016 | 91.53 | 0 | 43.0 | 37.66 | 36.00 | 31.00 | 28.60 | 23.00 | 18.00 |
Table 44: Footscray nitrogen dioxide percentiles
| (% days) | (days) | Max | 99th | 98th | 95th | 90th | 75th | 50th | |
|---|---|---|---|---|---|---|---|---|---|
| 2020 | 97.81 | 0 | 64.8 | 39.53 | 37.84 | 35.23 | 32.43 | 26.67 | 19.20 |
| 2019 | 97.81 | 0 | 49.1 | 43.52 | 41.64 | 36.70 | 32.54 | 27.90 | 21.70 |
| 2018 | 98.63 | 0 | 46.0 | 40.64 | 38.00 | 35.05 | 32.00 | 27.00 | 21.00 |
| 2017 | 92.88 | 0 | 50.0 | 47.24 | 42.48 | 39.00 | 35.20 | 29.00 | 23.00 |
| 2016 | 95.08 | 0 | 52.0 | 41.24 | 37.81 | 35.00 | 32.33 | 25.63 | 20.05 |
Table 45: Geelong South nitrogen dioxide percentiles
| (% days) | (days) | Max | 99th | 98th | 95th | 90th | 75th | 50th | |
|---|---|---|---|---|---|---|---|---|---|
| 2020 | 93.44 | 0 | 52.8 | 41.79 | 35.12 | 28.40 | 25.99 | 21.17 | 13.85 |
| 2019 | 95.62 | 0 | 38.2 | 34.51 | 31.34 | 29.04 | 25.30 | 21.20 | 13.90 |
| 2018 | 88.22 | 0 | 51.0 | 37.58 | 34.00 | 29.95 | 26.00 | 19.00 | 14.00 |
| 2017 | 94.79 | 0 | 42.0 | 37.75 | 34.00 | 30.00 | 27.00 | 21.00 | 15.00 |
| 2016 | 95.63 | 0 | 44.1 | 36.60 | 30.95 | 28.17 | 25.03 | 20.60 | 14.00 |
Table 46: Traralgon nitrogen dioxide percentiles
| (% days) | (days) | Max | 99th | 98th | 95th | 90th | 75th | 50th | |
|---|---|---|---|---|---|---|---|---|---|
| 2020 | 92.90 | 0 | 32.0 | 27.86 | 26.84 | 25.01 | 22.90 | 18.45 | 12.65 |
| 2019 | 87.67 | 0 | 34.7 | 33.58 | 31.57 | 28.71 | 24.61 | 19.83 | 14.05 |
| 2018 | 96.99 | 0 | 53.0 | 31.00 | 30.00 | 27.00 | 25.00 | 20.00 | 12.00 |
| 2017 | 90.68 | 0 | 34.0 | 31.00 | 30.00 | 27.00 | 24.00 | 20.00 | 13.00 |
| 2016 | 86.61 | 0 | 36.0 | 32.84 | 30.00 | 27.00 | 24.00 | 20.00 | 14.00 |
4.6 Ozone (O3)
Overall trends in ozone concentrations as shown in Tables 47 to 60 are generally consistent from year to year, however there can be significant variation in the number of exceedances and higher percentiles, depending on pollution events during the year. The number of exceedances and higher percentiles are greater for years where there are significant bushfires like those experienced in 2020. This is due to the emissions of chemicals in smoke which can lead to the formation of ozone. The hotter conditions typically associated with major bushfires are also more conducive to ozone formation.
Table 47: Alphington ozone percentiles
| (% days) | (days) | Max | 99th | 98th | 95th | 90th | 75th | 50th | |
|---|---|---|---|---|---|---|---|---|---|
| 2020 | 94.81 | 1 | 129.2 | 74.13 | 65.40 | 47.24 | 37.76 | 30.75 | 25.90 |
| 2019 | 97.53 | 1 | 109.4 | 69.27 | 58.15 | 52.47 | 43.40 | 31.72 | 26.85 |
| 2018 | 97.81 | 0 | 80.9 | 59.00 | 54.88 | 49.00 | 43.00 | 32.10 | 28.00 |
| 2017 | 85.75 | 0 | 73.0 | 60.88 | 57.00 | 50.00 | 40.00 | 30.00 | 25.00 |
| 2016 | 96.45 | 0 | 66.0 | 58.48 | 53.96 | 47.40 | 37.00 | 28.00 | 22.00 |
Table 48: Dandenong ozone percentiles
| (% days) | (days) | Max | 99th | 98th | 95th | 90th | 75th | 50th | |
|---|---|---|---|---|---|---|---|---|---|
| 2020 | 98.09 | 1 | 110.9 | 74.79 | 55.29 | 43.11 | 36.74 | 30.50 | 26.4 |
| 2019 | 95.62 | 1 | 109.7 | 68.92 | 59.60 | 50.76 | 43.70 | 30.90 | 26.7 |
| 2018 | 97.26 | 0 | 93.6 | 59.92 | 51.92 | 45.30 | 41.00 | 31.65 | 27.0 |
| 2017 | 46.85 | 0 | 69.0 | 66.60 | 61.60 | 58.00 | 53.00 | 41.50 | 31.0 |
| 2016 | 41.80 | 0 | 60.0 | 58.14 | 56.96 | 53.40 | 46.00 | 36.00 | 26.3 |
Table 49: Footscray ozone percentiles
| (% days) | (days) | Max | 99th | 98th | 95th | 90th | 75th | 50th | |
|---|---|---|---|---|---|---|---|---|---|
| 2020 | 98.09 | 2 | 117.1 | 72.78 | 62.64 | 43.73 | 35.52 | 29.15 | 25.70 |
| 2019 | 91.23 | 0 | 87.8 | 67.70 | 60.72 | 50.28 | 42.48 | 30.90 | 26.00 |
| 2018 | 49.86 | 0 | 88.8 | 70.14 | 62.52 | 52.19 | 47.90 | 38.00 | 30.00 |
| 2017 | 98.08 | 0 | 79.0 | 63.00 | 56.72 | 51.00 | 43.30 | 31.00 | 27.00 |
| 2016 | 64.48 | 0 | 65.3 | 55.26 | 52.40 | 44.23 | 40.05 | 30.30 | 23.55 |
Table 50: Geelong South ozone percentiles
| (% days) | (days) | Max | 99th | 98th | 95th | 90th | 75th | 50th | |
|---|---|---|---|---|---|---|---|---|---|
| 2020 | 93.72 | 1 | 113.9 | 73.96 | 51.87 | 44.40 | 35.0 | 29.90 | 27.1 |
| 2019 | 96.16 | 0 | 75.8 | 64.15 | 59.30 | 49.10 | 38.3 | 30.40 | 26.9 |
| 2018 | 86.58 | 0 | 69.0 | 61.25 | 51.40 | 45.50 | 39.0 | 31.23 | 28.0 |
| 2017 | 97.26 | 0 | 67.0 | 58.00 | 56.92 | 48.00 | 42.0 | 32.00 | 29.0 |
| 2016 | 98.09 | 0 | 56.0 | 52.13 | 47.84 | 42.82 | 35.2 | 28.30 | 25.4 |
Table 51: Melton ozone percentiles
| (% days) | (days) | Max | 99th | 98th | 95th | 90th | 75th | 50th | |
|---|---|---|---|---|---|---|---|---|---|
| 2020 | 95.08 | 2 | 128.3 | 74.42 | 62.75 | 46.62 | 38.48 | 32.12 | 28.7 |
| 2019 | 96.99 | 0 | 76.3 | 69.62 | 64.28 | 51.51 | 47.47 | 34.38 | 29.6 |
| 2018 | 98.63 | 0 | 85.0 | 63.23 | 55.82 | 48.16 | 41.80 | 34.00 | 30.0 |
| 2017 | 44.38 | 0 | 73.0 | 70.39 | 68.00 | 63.95 | 55.00 | 46.00 | 33.0 |
| 2016 | 48.36 | 0 | 70.0 | 62.20 | 58.48 | 52.00 | 46.00 | 38.00 | 28.0 |
Table 52: Point Cook ozone percentiles
| (% days) | (days) | Max | 99th | 98th | 95th | 90th | 75th | 50th | |
|---|---|---|---|---|---|---|---|---|---|
| 2020 | 59.56 | 0 | 55.6 | 49.96 | 46.97 | 41.32 | 35.96 | 32.08 | 29.8 |
| 2019 | 75.62 | 0 | 67.3 | 65.17 | 63.05 | 53.12 | 44.10 | 32.20 | 28.7 |
| 2018 | 98.08 | 0 | 81.7 | 66.00 | 57.00 | 48.00 | 41.00 | 33.00 | 30.0 |
| 2017 | 46.58 | 0 | 80.0 | 66.41 | 62.24 | 57.55 | 52.00 | 41.00 | 29.0 |
| 2016 | 54.64 | 0 | 66.0 | 61.04 | 59.00 | 49.10 | 43.10 | 33.00 | 26.0 |
Table 53: Traralgon ozone percentiles
| (% days) | (days) | Max | 99th | 98th | 95th | 90th | 75th | 50th | |
|---|---|---|---|---|---|---|---|---|---|
| 2020 | 89.89 | 1 | 107.5 | 70.79 | 56.07 | 40.94 | 35.80 | 29.80 | 25.50 |
| 2019 | 95.34 | 0 | 88.9 | 66.16 | 60.25 | 51.96 | 43.03 | 30.90 | 26.55 |
| 2018 | 50.96 | 0 | 67.0 | 54.45 | 52.86 | 47.67 | 42.00 | 33.88 | 27.20 |
| 2017 | 97.81 | 0 | 64.0 | 52.44 | 48.88 | 43.00 | 38.00 | 30.00 | 26.00 |
| 2016 | 90.16 | 0 | 63.0 | 50.97 | 43.42 | 38.00 | 33.00 | 28.00 | 25.00 |
Table 54: Alphington 4-hour ozone percentiles
| (% days) | (days) | Max | 99th | 98th | 95th | 90th | 75th | 50th | |
|---|---|---|---|---|---|---|---|---|---|
| 2020 | 92.90 | 1 | 119.15 | 71.57 | 59.18 | 43.09 | 36.14 | 29.41 | 24.89 |
| 2019 | 94.25 | 1 | 96.80 | 60.08 | 54.30 | 49.11 | 41.45 | 30.17 | 25.37 |
| 2018 | 95.62 | 0 | 75.75 | 54.04 | 50.59 | 45.23 | 38.80 | 30.78 | 26.50 |
| 2017 | 83.84 | 0 | 67.00 | 55.50 | 53.95 | 47.81 | 39.12 | 28.00 | 24.00 |
| 2016 | 94.54 | 0 | 58.25 | 51.94 | 50.30 | 43.75 | 35.12 | 26.75 | 21.67 |
Table 55: Dandenong 4-hour ozone percentiles
| (% days) | (days) | Max | 99th | 98th | 95th | 90th | 75th | 50th | |
|---|---|---|---|---|---|---|---|---|---|
| 2020 | 96.99 | 2 | 98.00 | 69.13 | 50.81 | 39.82 | 34.27 | 29.86 | 25.20 |
| 2019 | 94.52 | 1 | 102.33 | 59.68 | 56.94 | 48.83 | 42.11 | 29.90 | 25.33 |
| 2018 | 96.44 | 1 | 82.92 | 56.23 | 49.50 | 43.19 | 38.59 | 30.33 | 26.00 |
| 2017 | 46.03 | 0 | 64.00 | 59.00 | 57.25 | 53.75 | 50.90 | 38.54 | 29.38 |
| 2016 | 41.26 | 0 | 56.50 | 55.25 | 53.67 | 49.06 | 43.00 | 33.25 | 24.65 |
Table 56: Footscray 4-hour ozone percentiles
| (% days) | (days) | Max | 99th | 98th | 95th | 90th | 75th | 50th | |
|---|---|---|---|---|---|---|---|---|---|
| 2020 | 96.45 | 2 | 108.38 | 68.98 | 57.61 | 40.14 | 34.00 | 28.27 | 24.27 |
| 2019 | 84.66 | 0 | 77.50 | 60.53 | 55.75 | 47.88 | 40.24 | 29.22 | 24.65 |
| 2018 | 49.86 | 1 | 82.17 | 66.69 | 58.85 | 49.47 | 43.98 | 35.75 | 28.25 |
| 2017 | 96.44 | 0 | 67.00 | 58.35 | 50.75 | 45.86 | 39.93 | 29.75 | 25.75 |
| 2016 | 63.11 | 0 | 52.92 | 50.85 | 48.28 | 41.94 | 38.17 | 28.41 | 22.50 |
Table 57: Geelong South 4-hour ozone percentiles
| (% days) | (days) | Max | 99th | 98th | 95th | 90th | 75th | 50th | |
|---|---|---|---|---|---|---|---|---|---|
| 2020 | 93.44 | 2 | 95.50 | 63.42 | 48.29 | 40.60 | 33.67 | 28.95 | 25.89 |
| 2019 | 94.79 | 0 | 69.53 | 57.73 | 54.04 | 45.26 | 36.81 | 29.57 | 25.98 |
| 2018 | 84.38 | 0 | 67.25 | 50.44 | 47.75 | 41.63 | 35.83 | 30.69 | 27.12 |
| 2017 | 95.07 | 0 | 61.00 | 56.31 | 52.00 | 46.02 | 39.75 | 31.00 | 28.00 |
| 2016 | 97.54 | 0 | 51.02 | 47.22 | 44.16 | 38.16 | 32.32 | 27.25 | 24.27 |
Table 58: Melton 4-hour ozone percentiles
| (% days) | (days) | Max | 99th | 98th | 95th | 90th | 75th | 50th | |
|---|---|---|---|---|---|---|---|---|---|
| 2020 | 93.99 | 3 | 119.35 | 67.63 | 60.43 | 43.69 | 36.67 | 31.61 | 27.86 |
| 2019 | 96.16 | 0 | 66.25 | 59.66 | 57.27 | 49.50 | 43.63 | 32.73 | 28.72 |
| 2018 | 97.81 | 0 | 72.00 | 56.91 | 51.85 | 47.00 | 40.05 | 32.50 | 29.00 |
| 2017 | 44.38 | 0 | 66.50 | 64.17 | 61.70 | 59.06 | 51.65 | 43.62 | 31.75 |
| 2016 | 48.09 | 0 | 58.25 | 56.81 | 52.75 | 49.38 | 43.25 | 35.54 | 26.62 |
Table 59: Point Cook 4-hour ozone percentiles
| (% days) | (days) | Max | 99th | 98th | 95th | 90th | 75th | 50th | |
|---|---|---|---|---|---|---|---|---|---|
| 2020 | 59.29 | 0 | 50.55 | 46.30 | 43.44 | 38.78 | 34.58 | 31.38 | 29.02 |
| 2019 | 74.79 | 0 | 63.20 | 58.62 | 57.03 | 49.79 | 41.02 | 30.67 | 27.82 |
| 2018 | 97.26 | 0 | 71.10 | 61.61 | 53.78 | 44.08 | 38.40 | 32.00 | 28.50 |
| 2017 | 46.30 | 0 | 70.50 | 61.67 | 56.25 | 55.05 | 48.55 | 37.50 | 28.25 |
| 2016 | 54.37 | 0 | 57.00 | 56.76 | 55.06 | 46.00 | 40.35 | 32.12 | 25.50 |
Table 60: Traralgon 4-hour ozone percentiles
| (% days) | (days) | Max | 99th | 98th | 95th | 90th | 75th | 50th | |
|---|---|---|---|---|---|---|---|---|---|
| 2020 | 88.52 | 1 | 101.55 | 62.56 | 50.80 | 38.43 | 33.08 | 28.44 | 24.36 |
| 2019 | 94.79 | 0 | 75.50 | 61.29 | 55.68 | 48.59 | 38.88 | 28.96 | 24.76 |
| 2018 | 50.96 | 0 | 61.25 | 51.98 | 50.27 | 41.73 | 39.12 | 31.56 | 25.62 |
| 2017 | 97.81 | 0 | 55.50 | 48.57 | 44.97 | 40.35 | 35.25 | 28.67 | 24.75 |
| 2016 | 89.89 | 0 | 58.70 | 47.18 | 40.80 | 35.40 | 30.80 | 27.00 | 23.50 |
4.7 Sulfur dioxide (SO2)
Overall trends in sulfur dioxide as shown in Tables 61 to 68 are generally consistent from year to year, with most NEPM stations recording values close to the instruments’ limit of detection. Stations such as Altona North, Geelong South and Traralgon are situated near major industrial sources, and show that there is ongoing variation in sulfur dioxide concentrations between years.
Table 61: Alphington sulfur dioxide percentiles
| (% days) | (days) | Max | 99th | 98th | 95th | 90th | 75th | 50th | |
|---|---|---|---|---|---|---|---|---|---|
| 2020 | 84.70 | 0 | 5.3 | 4.39 | 3.85 | 2.76 | 2.20 | 1.4 | 0.8 |
| 2019 | 90.14 | 0 | 10.2 | 6.17 | 5.38 | 3.96 | 3.22 | 2.1 | 1.2 |
| 2018 | 96.99 | 0 | 13.0 | 7.19 | 6.94 | 5.00 | 3.00 | 2.0 | 1.0 |
| 2017 | 95.62 | 0 | 11.0 | 6.00 | 5.04 | 5.00 | 4.00 | 2.0 | 1.0 |
| 2016 | 91.80 | 0 | 9.0 | 7.65 | 7.00 | 5.00 | 4.00 | 2.0 | 1.0 |
Table 62: Altona sulfur dioxide percentiles
| (% days) | (days) | Max | 99th | 98th | 95th | 90th | 75th | 50th | |
|---|---|---|---|---|---|---|---|---|---|
| 2020 | 23.22 | 0 | 43.6 | 41.08 | 32.98 | 26.80 | 19.58 | 8.70 | 3.9 |
| 2019 | 47.95 | 0 | 35.1 | 30.14 | 28.30 | 25.23 | 20.84 | 10.65 | 4.3 |
| 2018 | 84.93 | 0 | 53.0 | 36.82 | 34.00 | 28.55 | 19.00 | 11.00 | 4.0 |
| 2017 | 94.79 | 0 | 49.0 | 37.75 | 34.00 | 25.00 | 18.50 | 10.00 | 4.0 |
| 2016 | 92.62 | 0 | 44.0 | 38.00 | 32.00 | 24.00 | 19.00 | 7.50 | 3.0 |
Table 63: Geelong South sulfur dioxide percentiles
| (% days) | (days) | Max | 99th | 98th | 95th | 90th | 75th | 50th | |
|---|---|---|---|---|---|---|---|---|---|
| 2020 | 80.60 | 0 | 27.4 | 14.22 | 8.52 | 4.45 | 3.26 | 1.5 | 0.6 |
| 2019 | 94.25 | 0 | 47.1 | 26.54 | 17.80 | 9.85 | 5.54 | 2.2 | 0.7 |
| 2018 | 89.86 | 0 | 29.0 | 12.46 | 9.14 | 7.00 | 5.00 | 2.0 | 1.0 |
| 2017 | 94.52 | 0 | 17.0 | 10.56 | 8.00 | 5.00 | 3.00 | 2.0 | 1.0 |
| 2016 | 79.23 | 0 | 10.1 | 7.11 | 6.44 | 5.30 | 4.12 | 2.3 | 1.0 |
Table 64: Traralgon sulfur dioxide percentiles
| (% days) | (days) | Max | 99th | 98th | 95th | 90th | 75th | 50th | |
|---|---|---|---|---|---|---|---|---|---|
| 2020 | 91.26 | 0 | 30.8 | 19.21 | 14.64 | 9.47 | 6.84 | 3.6 | 1.75 |
| 2019 | 93.15 | 0 | 49.9 | 30.47 | 26.32 | 15.24 | 8.71 | 5.2 | 2.80 |
| 2018 | 89.59 | 0 | 79.0 | 38.74 | 21.86 | 14.00 | 10.00 | 4.0 | 2.00 |
| 2017 | 94.79 | 0 | 63.0 | 35.60 | 22.20 | 11.75 | 9.00 | 6.0 | 3.00 |
| 2016 | 88.25 | 0 | 57.0 | 22.78 | 17.12 | 13.72 | 10.00 | 6.0 | 3.00 |
Table 65: Alphington daily sulfur dioxide percentiles
| (% days) | (days) | Max | 99th | 98th | 95th | 90th | 75th | 50th | |
|---|---|---|---|---|---|---|---|---|---|
| 2020 | 84.70 | 0 | 2.45 | 2.01 | 1.51 | 1.13 | 0.86 | 0.57 | 0.33 |
| 2019 | 90.14 | 0 | 2.10 | 1.79 | 1.46 | 1.21 | 0.99 | 0.64 | 0.37 |
| 2018 | 96.99 | 0 | 3.74 | 1.90 | 1.52 | 1.23 | 1.00 | 0.57 | 0.30 |
| 2017 | 95.62 | 0 | 2.57 | 1.79 | 1.52 | 1.22 | 1.00 | 0.57 | 0.30 |
| 2016 | 91.80 | 0 | 2.26 | 1.72 | 1.63 | 1.14 | 0.93 | 0.57 | 0.26 |
Table 66: Altona daily sulfur dioxide percentiles
| (% days) | (days) | Max | 99th | 98th | 95th | 90th | 75th | 50th | |
|---|---|---|---|---|---|---|---|---|---|
| 2020 | 23.22 | 0 | 9.61 | 9.40 | 8.02 | 6.48 | 4.56 | 2.43 | 1.25 |
| 2019 | 47.95 | 0 | 7.76 | 7.09 | 6.31 | 4.55 | 3.01 | 1.88 | 1.10 |
| 2018 | 84.93 | 0 | 14.91 | 9.39 | 8.76 | 5.42 | 3.17 | 1.86 | 1.02 |
| 2017 | 94.79 | 0 | 13.65 | 8.24 | 7.10 | 4.51 | 3.41 | 1.91 | 1.00 |
| 2016 | 92.62 | 0 | 13.04 | 7.94 | 6.21 | 4.00 | 3.05 | 1.54 | 0.74 |
Table 67: Geelong South daily sulfur dioxide percentiles
| (% days) | (days) | Max | 99th | 98th | 95th | 90th | 75th | 50th | |
|---|---|---|---|---|---|---|---|---|---|
| 2020 | 80.60 | 0 | 2.64 | 1.70 | 1.34 | 1.06 | 0.84 | 0.50 | 0.28 |
| 2019 | 94.25 | 0 | 5.09 | 3.00 | 2.36 | 1.58 | 1.02 | 0.57 | 0.21 |
| 2018 | 89.86 | 0 | 3.48 | 2.27 | 2.04 | 1.55 | 1.11 | 0.69 | 0.27 |
| 2017 | 94.52 | 0 | 2.30 | 1.81 | 1.57 | 1.17 | 0.91 | 0.61 | 0.17 |
| 2016 | 79.23 | 0 | 1.99 | 1.93 | 1.64 | 1.41 | 0.87 | 0.59 | 0.26 |
Table 68: Traralgon daily sulfur dioxide percentiles
| (% days) | (days) | Max | 99th | 98th | 95th | 90th | 75th | 50th | |
|---|---|---|---|---|---|---|---|---|---|
| 2020 | 91.26 | 0 | 5.56 | 3.23 | 2.33 | 2.03 | 1.47 | 0.94 | 0.56 |
| 2019 | 93.15 | 0 | 8.44 | 4.25 | 3.19 | 2.59 | 1.85 | 1.20 | 0.64 |
| 2018 | 89.59 | 0 | 9.57 | 4.66 | 3.02 | 2.12 | 1.61 | 0.98 | 0.48 |
| 2017 | 94.79 | 0 | 15.09 | 6.05 | 3.63 | 2.47 | 2.04 | 1.35 | 0.65 |
| 2016 | 88.25 | 0 | 6.35 | 4.72 | 4.03 | 2.90 | 2.26 | 1.39 | 0.87 |
Reviewed 21 September 2021
