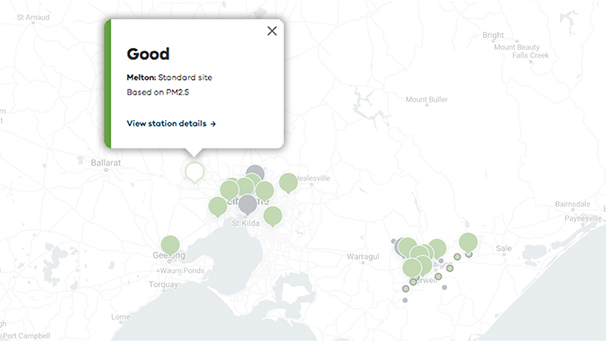
EPA AirWatch uses air quality categories to show the level of air pollutants at our monitoring sites across Victoria.
To calculate an air quality category we measure the average concentration of a pollutant in the air over an hour. We then compare this measurement to the pollutant's air quality guideline or standard.
Concentration ranges for air quality categories
|
Pollutant |
Measurement | Good | Fair | Poor | Very poor | Extremely poor |
|---|---|---|---|---|---|---|
| Ozone | ppb | Less than 50 |
50–100 |
100–150 | 150–300 |
300 and above |
| Nitrogen dioxide | ppb | Less than 60 |
60–120 |
120–180 |
180–360 |
360 and above |
| Sulfur dioxide | ppb | Less than 100 |
100–200 |
200–300 | 300–600 |
600 and above |
| PM10 | µg/m3 | Less than 40 | 40–80 |
80–120 |
120–300 |
300 and above |
| PM2.5 | µg/m3 | Less than 25 | 25–50 |
50–100 |
100–300 | 300 and above |
| Carbon monoxide | ppm | Less than 30 |
N/A |
30–70 |
N/A |
70 and above |
We determine the overall air quality category for a monitoring site by looking at these pollutants:
- PM2.5 particles
- PM10 particles
- ozone
- nitrogen dioxide
- sulfur dioxide.
We compare the pollutants’ concentrations and use the highest one as the overall site category.
The results for each site show the pollutant used to determine the category.

We've changed how we calculate air quality categories
Prior to November 2019, we calculated an air quality index for each station. Contact EPA for more information.
Read more about monitoring and forecasting air pollution
People sensitive to air pollution
Reviewed 13 January 2021


